
 English
 中文
中文
Bulletin
CropWatch bulletinMenu
- Overview
- Country analysis
- Argentina
- Australia
- Bangladesh
- Brazil
- Canada
- Germany
- Egypt
- Ethiopia
- France
- United Kingdom
- Indonesia
- India
- Iran
- Kazakhstan
- Cambodia
- Mexico
- Myanmar
- Nigeria
- Pakistan
- Philippines
- Poland
- Romania
- Russia
- Thailand
- Turkey
- Ukraine
- United States
- Uzbekistan
- Vietnam
- South Africa
- Afghanistan
- Belarus
- Mongolia
- Sri Lanka
- Zambia
- Mozambique
- Kenya
- Angola
- Hungary
- Italy
- Morocco
Authors: 超级管理员 | Edit: Miao
Aftera brief overview of the agro-climatic and agronomic conditions in China overthe reporting period (section 4.1), Chapter 4 presents an updated estimate ofnational winter crop production (4.2) and describes the situation by region,focusing on the seven most productive agro-ecological regions of the east andsouth: Northeast China, Inner Mongolia, Huanghuaihai, Loess region, LowerYangtze, Southwest China, and Southern China (4.3). Section 4.4 presents theresults of ongoing pests and diseases monitoring, while sections 4.5 and 4.6describe trade prospects (import/export) of major crops (4.5) and an updatedoutlook for domestic prices of maize, rice, wheat and soybean (4.6). Additionalinformation on the agro-climatic indicators for agriculturally importantChinese provinces are listed in table A.11 in Annex A.
4.1 Overview
Weather was generally favorable in China from July to October 2018, with rainfall and radiation increasing above average by 4% and 1%, respectively, and temperature slightly down by 0.4°C. As a result, the maximum VCI was rather high at 0.94. Moreover, the mean of CALF for the whole country was 2% above average. These results indicated favorable situation of crop production in China during this season, which was confirmed by the relatively high yields of main crops, with those of maize, wheat and soybean increasing 1.5%, 1.4% and 1.5%, respectively, above their 2017 values. Rice yield, however, was slightly reduced (-0.9%).
At the regional scale, rainfall was above average by 28%, 9%, 15% and 12% in Inner Mongolia, Lower Yangtze, Northeast China and Southern China, whereas Huanghuahai, the Loess region and Southwest China might have suffered from water deficit, with precipitation drops in these regions amounting to 10%, 8% and 9%, respectively, compared with average (Table 4.1). As shown by Figure 4.1, 14.9% of planted areas experienced excess rainfall (about 120 mm above average) in early August, including the southern part of Northeast China (southern Jilin province and most parts of Liaoning province), Shandong province, Anhui province and Jiangsu province. On the contrary, 39% of cropped areas suffered from serious water deficits in early July, with rainfall short by more than 45 mm, most of them located in Southwest China (especially Guizhou province and Chongqing city) and Lower Yangtze (Hubei province, Jiangxi province and Zhejiang province). Temperatures in all regions were close to average, with the anomalies ranging between -0.9°C and +0.3°C. However, temperature departures fluctuated obviously in most of China over time (Figure 4.2). Temperature was more than 1.5°C above average during early and late July while more than 3°C below average in mid-September for 51.2% of planted areas, mainly located in the central part of China. In addition, temperature in the southern part of China, accounting for 34.8% of cropped areas, was 0.75°C above average during early July but 2.5 below average during mid-September and early October.
As shown by Figure 4.3, almost all the arable land in China was cropped, mainly because this monitoring period is the peak of farming in China. According to the maximum VCI map(Figure 4.4), very high values (greater than 1) occurred in northern and northeastern China. The maximum VCI in other regions was also relatively high, with the values between 0.5 and 1.The VHIm map shows that high values (51-100) were mainly located in Inner Mongolia and Northeast China, with moderate values (16-50) appearing in most other regions (Figure 4.5). However, low values (1-15) sporadically occurred in the central part of China (northern Anhui and Henan province and southern Hebei province), implying these areas might have been exposed to drought.
Table 4.1. CropWatch agroclimatic and agronomic indicators for China, July-October 2018, departure from 5YA and 15YA
|
Region | Agroclimatic indicators | Agronomic indicators | |||||
| Departure from 15YA (2003-2017) | Departure from 5YA (2013-2017) | Current | |||||
| RAIN (%) | TEMP (°C) | RADPAR (%) | BIOMSS (%) | CALF (%) | CI (%) | Maximum VCI | |
| Huanghuaihai | -10 | 0.3 | 6 | -22 | -1 | -1 | 0.90 |
| Inner Mongolia | 28 | -0.4 | -2 | -4 | 9 | 0 | 0.97 |
| Loess region | -8 | -0.2 | 4 | -24 | 10 | -2 | 0.97 |
| Lower Yangtze | 9 | -0.6 | 4 | 17 | -1 | 4 | 0.92 |
| Northeast China | 15 | 0.1 | -3 | -13 | 0 | -1 | 0.96 |
| Southern China | 12 | -0.9 | -5 | -2 | -1 | -1 | 0.94 |
| Soutwest China | -9 | -0.6 | 1 | -6 | -0 | -1 | 0.94 |
Figure 4.1. China spatial distribution of rainfall profiles, July-October 2018

Figure 4.2. China spatial distribution of temperature profiles, July-October 2018
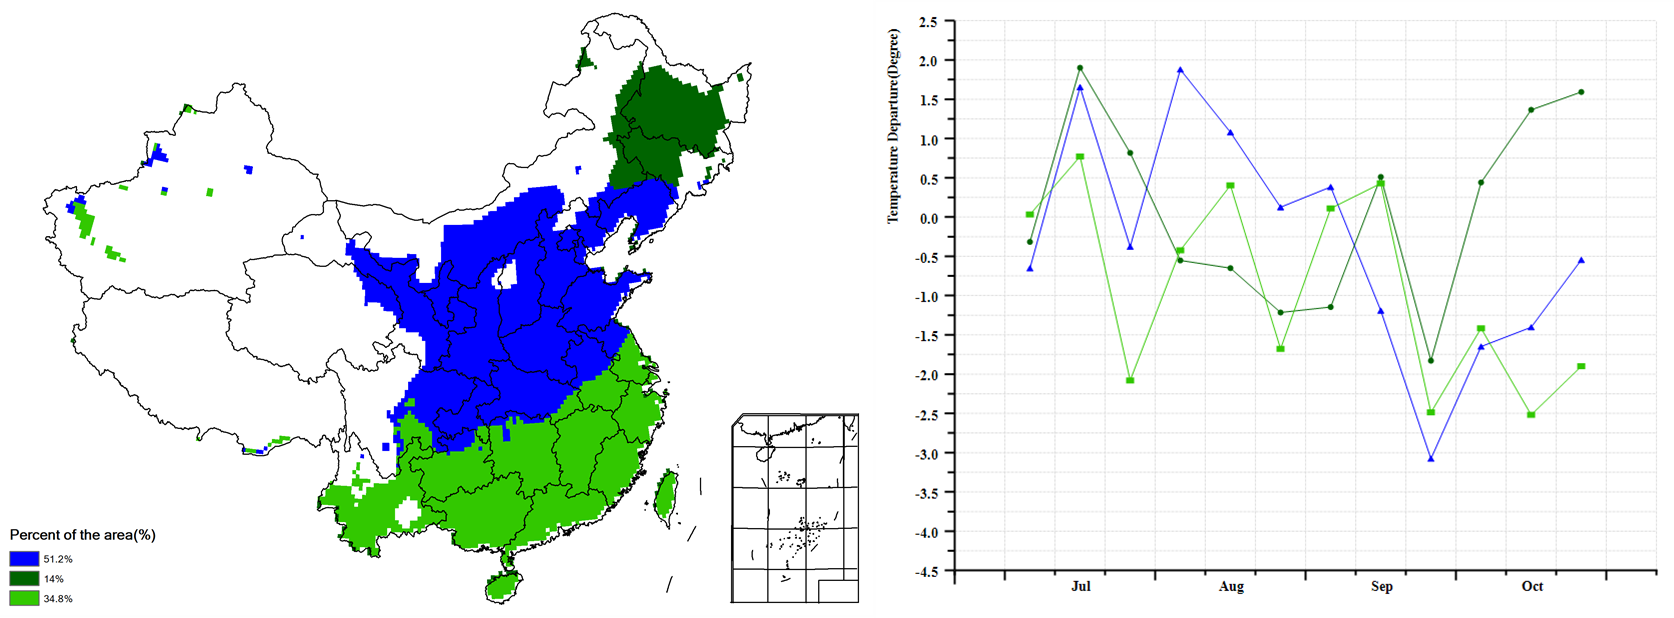
Figure 4.3. China cropped and uncropped arableland, by pixel, July-October 2018
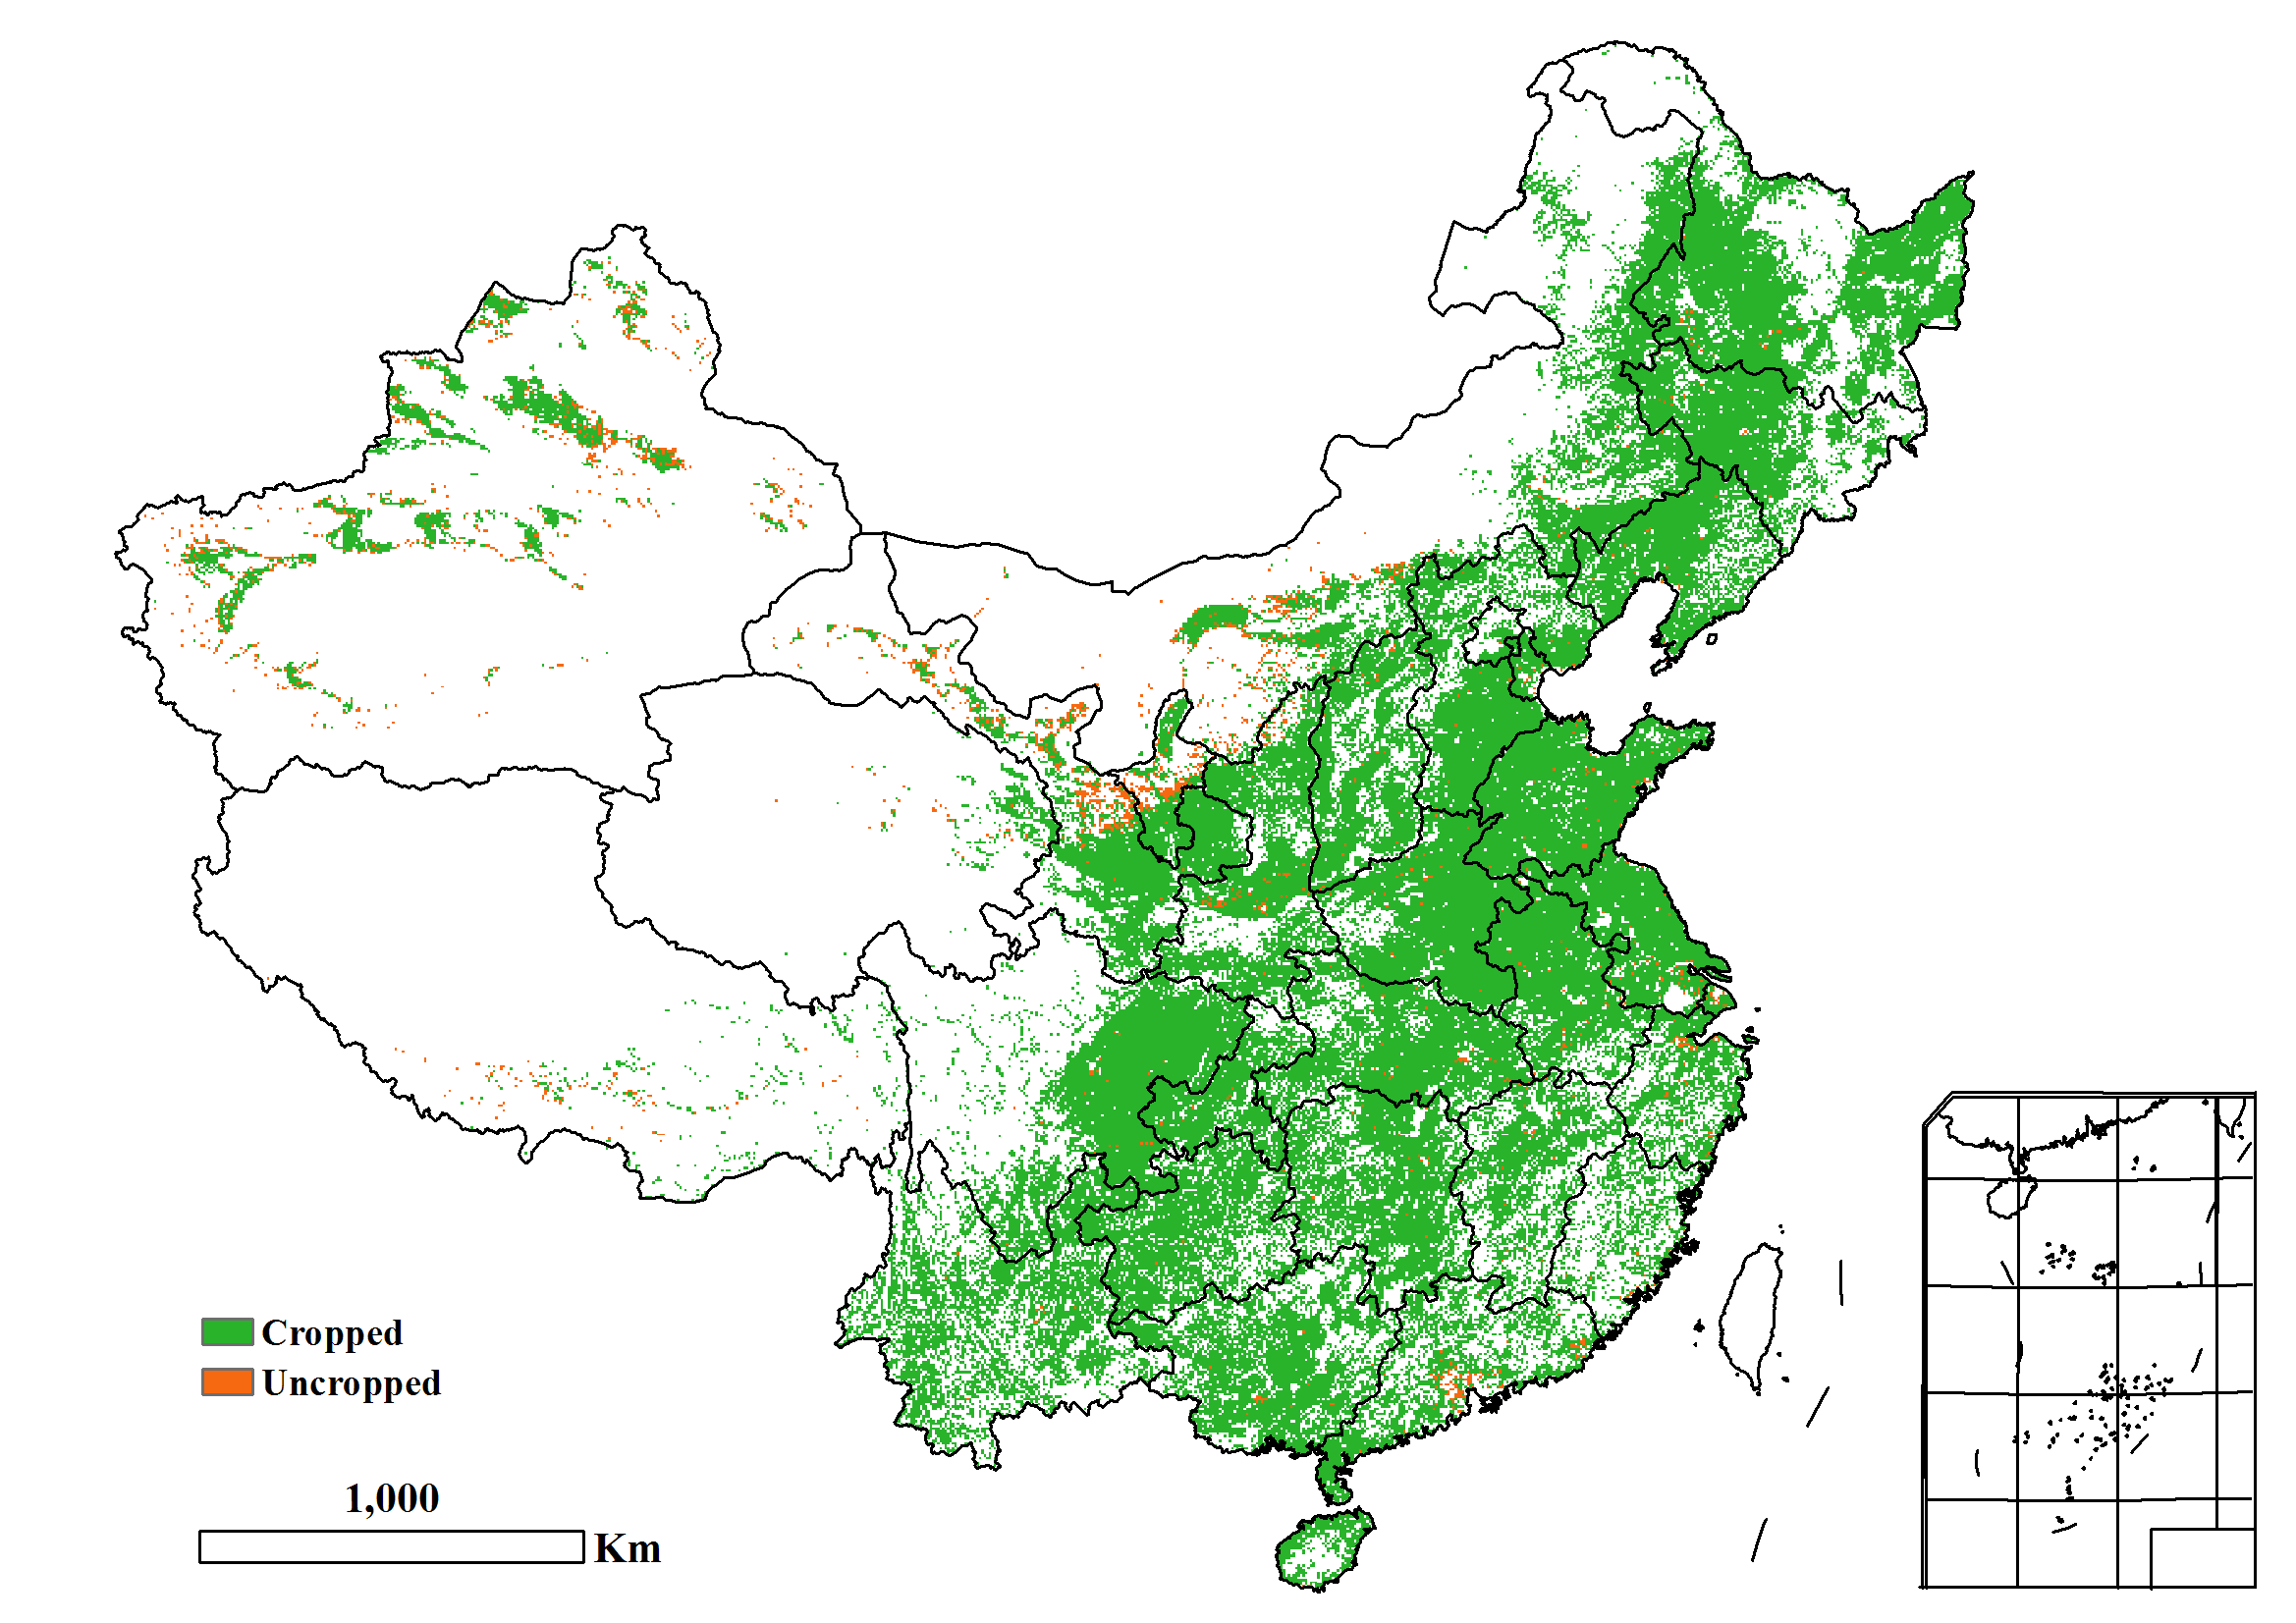
Figure 4.4. China maximum Vegetation Condition Index (VCIx), by pixel, July-October 2018
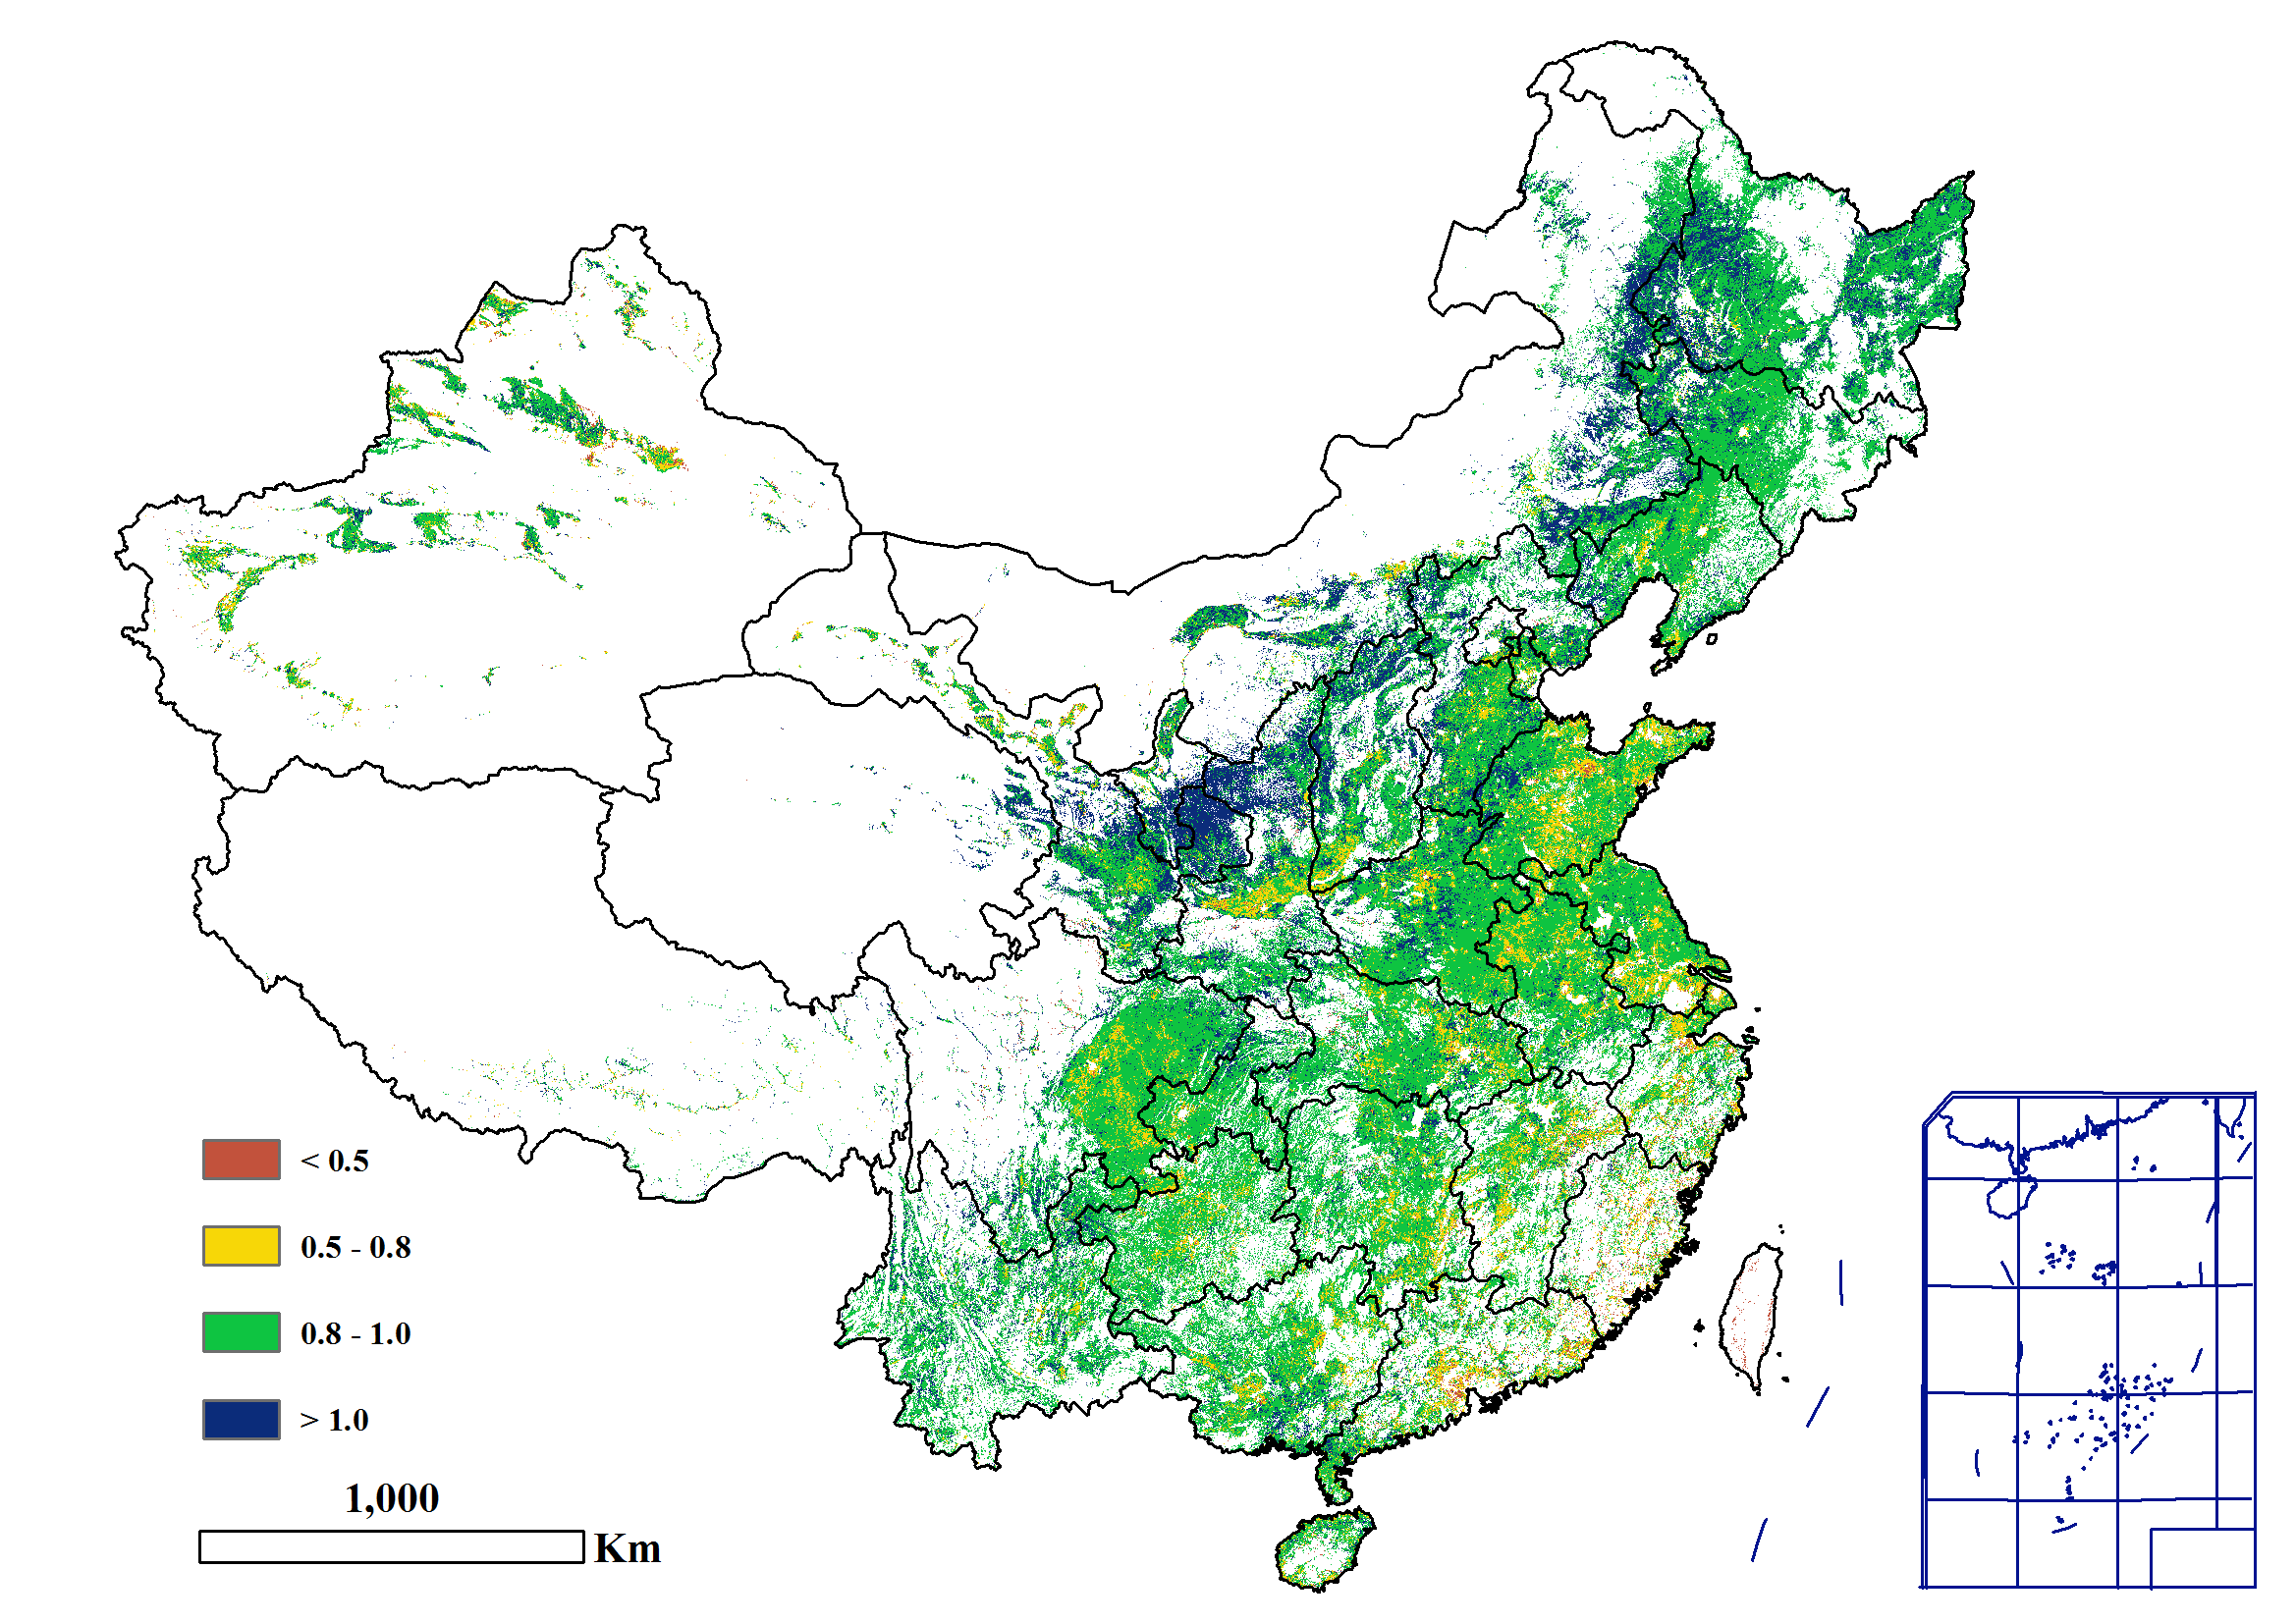
Figure 4.5. China minimum Vegetation health Index (VHIm), by pixel, July-October 2018

Figure 4.6. China Cropping Intensity, by pixel, July-October 2018
