
 English
 中文
中文
Bulletin
CropWatch bulletinMenu
- Overview
- Country analysis
- Argentina
- Australia
- Bangladesh
- Brazil
- Canada
- Germany
- Egypt
- Ethiopia
- France
- United Kingdom
- Indonesia
- India
- Iran
- Kazakhstan
- Cambodia
- Mexico
- Myanmar
- Nigeria
- Pakistan
- Philippines
- Poland
- Romania
- Russia
- Thailand
- Turkey
- Ukraine
- United States
- Uzbekistan
- Vietnam
- South Africa
- Afghanistan
- Belarus
- Mongolia
- Sri Lanka
- Zambia
- Mozambique
- Kenya
- Angola
- Hungary
- Italy
- Morocco
Authors: 超级管理员 | Edit: Miao
5.3 Update on El Niño
Weak El Nino condition has appeared across the Pacific Ocean during the third quarter of 2018. Figure 1. illustrates the behavior of the standard Southern Oscillation Index (SOI) of the Australian Bureau of Meteorology (BOM) from October 2017 to October 2018. Sustained positive values of the SOI above +7 typically indicate La Niña while sustained negative values below −7 typically indicate El Niño. Values between about +7 and −7 generally indicate neutral conditions.
During the current season, SOI decreased suddenly from +1.6 in July to -6.9 in August, further to -10 in September indicating a weak El Nino trend. However, it increased to +3 in October again.
Figure 5.5. Monthly SOI-BOM time series from October 2017 to October 2018

Source: http://www.bom.gov.au/climate/current/soi2.shtml
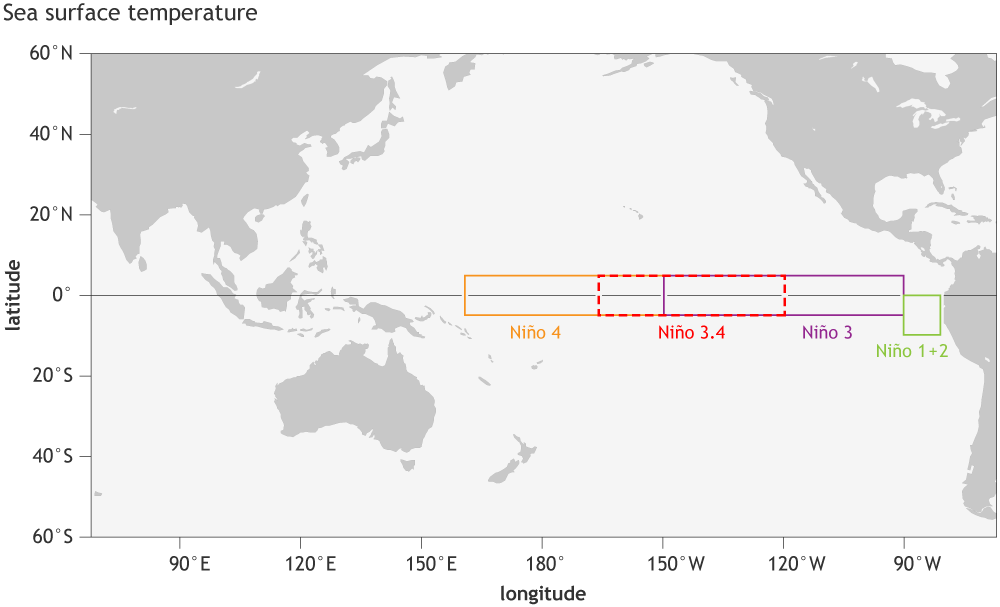
The sea surface temperature anomalies in October, 2018 for NINO3, NINO3.4 and NINO4 regions are +0.8°C, +0.8°C, and +0.9°C in sequence, warmer than 1961-1990 average according to BOM monitored (see Figure 5.7). Both of BOM and NOAA think that the warmer condition indicates a weak El Niño trend and their ENSO’s outlook lies at El Niño ALERT in the following winter of Northern Hemisphere. CropWatch will keep on monitoring its condition.
Figure 5.6. Map of NINO Region
Source:https://www.climate.gov/sites/default/files/Fig3_ENSOindices_SST_large.png
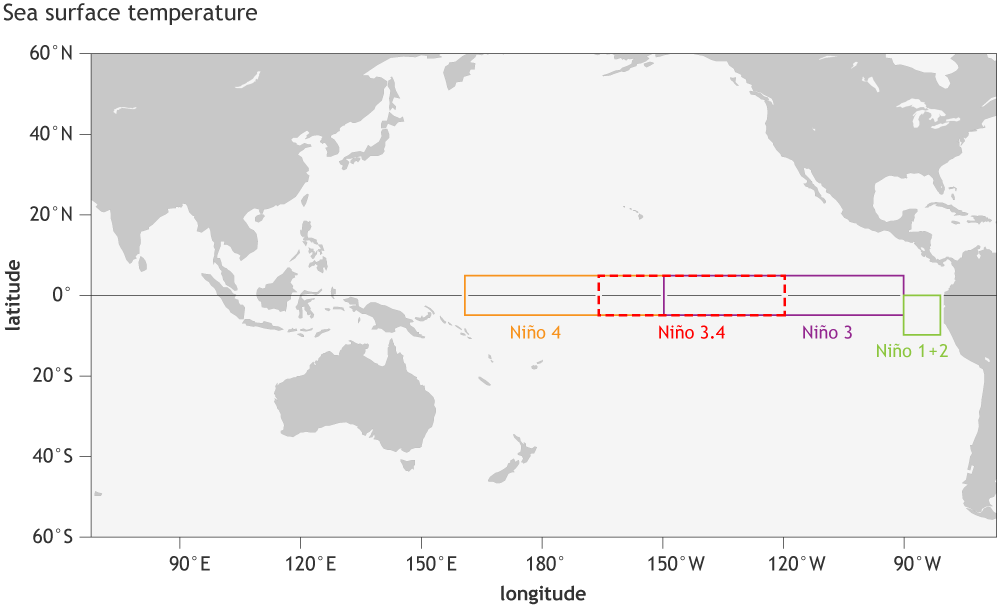
Figure 5.7. October 2018 sea surface temperature departure from the 1961-1990 average

Source: http://www.bom.gov.au/climate/enso/wrap-up/archive/20181107.ssta_pacific_monthly.png
