 English
 中文
中文
Bulletin
wall bulletinMenu
- Overview
- Country analysis
- Argentina
- Australia
- Bangladesh
- Brazil
- Canada
- Germany
- Egypt
- Ethiopia
- France
- United Kingdom
- Indonesia
- India
- Iran
- Kazakhstan
- Cambodia
- Mexico
- Myanmar
- Nigeria
- Pakistan
- Philippines
- Poland
- Romania
- Russia
- Thailand
- Turkey
- Ukraine
- United States
- Uzbekistan
- Vietnam
- South Africa
- Afghanistan
- Belarus
- Mongolia
- Sri Lanka
- Zambia
- Mozambique
- Kenya
- Angola
- Hungary
- Italy
- Morocco
- UK
Authors: 超级管理员 | Edit: Miao
Germany
Crops in Germany showed spatially diverse condition during the reporting period, which covered the late stages of sugar beets (October harvest) and early vegetative stages of winter wheat and winter barley. For the country as a whole, total precipitation (as measured by the RAIN indicator) was 6% below average, temperature was above average (TEMP, +0.7°C), and radiation was above average as well (RADPAR, +6%). Negative rainfall departures occurred mostly from early to mid-October, November, mid-December and after mid-January, while above average rainfall occurred throughout the country in late October, late November and late December. Temperatures was above average over most of Germany (+0.7°C) with peaks in late October, late November, mid-December and late January. Due to favorable temperature, the biomass production potential (BIOMSS) is expected to increase by 4% nationwide compared to the five-year average.
According to the national crop condition development graph, NDVI was affected by snow, resulting in values being below average during the whole reporting period, except in late November . These observations are confirmed by the spatial NDVI profiles. VCIx was low in some regions, but the average for Germany as a whole reached 0.91 over this reporting period. The snow has probably protected crops from cold weather and will continue to provide soil moisture. The outlook of winter crops is above average.
Regional analysis
Based on cropping systems, climatic zones, and topographic conditions, six sub-national regions can be distinguished for Germany. The ones which are most relevant for crops cultivation are the Northern wheat zone, North-west mixed wheat and sugar beets zone, and the Central wheat zone. Numbers identify the areas on the maps.
Schleswig-Holstein and the Baltic coast is the major winter wheat zone of Germany. The CropWatch agroclimatic indicators show that this region experienced a precipitation deficit (-20%) with warm weather (TEMP, +0.9°C) and radiation above average (RADPAR, +9%). With suitable temperature, biomass (BIOMSS) in this zone is expected to increase by 4% compared to the five-year average. Due to snow storms, NDVI started dropping from January. The area has a high CALF (100%) as well as a favorable VCIx (0.97), indicating favorable crop prospects.
Wheat and sugar-beets are major crops in the Mixed wheat and sugar-beets zone of the north-west. The CropWatch agroclimatic indicator RAIN was below average (-11%), temperature was above (TEMP +0.6°C) and so was radiation (RADPAR, +7%). Biomass (BIOMSS) in this zone is expected to increase by 4% compared to the five-year average with suitable temperature and radiation condition. As shown in the crop condition development graph based on NDVI, the values were above average after mid-November. The area has a high CALF (100%) and crop condition for the region is good according to the high VCIx (0.91).
Central wheat zone of Saxony and Thuringia is another major winter wheat zone; it recorded about 11% below average rainfall and experienced warmer than average weather (TEMP +0.7°C) and good sunshine (RADPAR +6%). The biomass production potential (BIOMSS indicator) was average. The area has a high CALF (99%) and the VCIx of 0.85 for this region also shows favorable crop prospects.
The cropland in the Sparse crop area of the east-German lake and Heathland and Western sparse crop area of the Rhenish massif was more marginal. Dry weather was recorded in the second (RAIN -3% and -12%, respectively), as well as above average temperatures (+1.0°C and +0.6°C) and radiation (RADPAR +7% and +6%). Compared to the average of the last five years, BIOMSS was higher by 5% and 1%, respectively, while the Cropped Arable Land Fraction was at 99% and 95%. As shown in the crop condition development graph based on NDVI, the values in both regions were all below average during the whole reporting period, showing unfavorable crop prospects for the regions.
Next to wheat, two summer crops (maize and potato) are the major crops on the Bavarian Plateau. The CropWatch agroclimatic indicators were slightly above average (RAIN +8%, TEMP +0.6°C, RADPAR +5%). Compared to the five-year average, BIOMSS increased 6%. The area has a high CALF (99%) as well as a favorable VCIx (0.92), indicating high cropped area and favorable winter crop prospects.
Figure 3.15. Germany’s crop condition, October 2018-January 2019

Figure 3.10a. Germany phenology of major crops
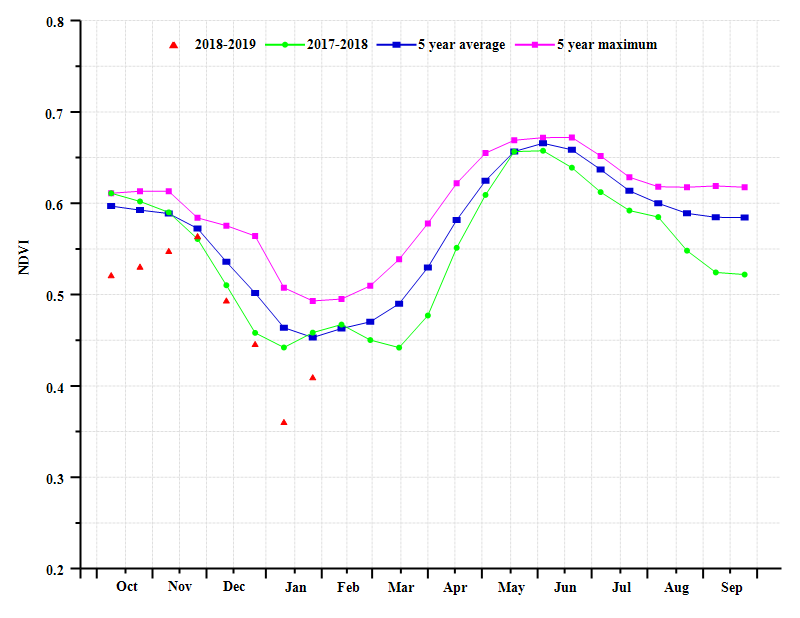
Figure 3.10b. Germnay national level crop condition development graph based on NDVI, comparing the October 2018-January 2019 period to the previous season and the five-year average (5YA) and maximum
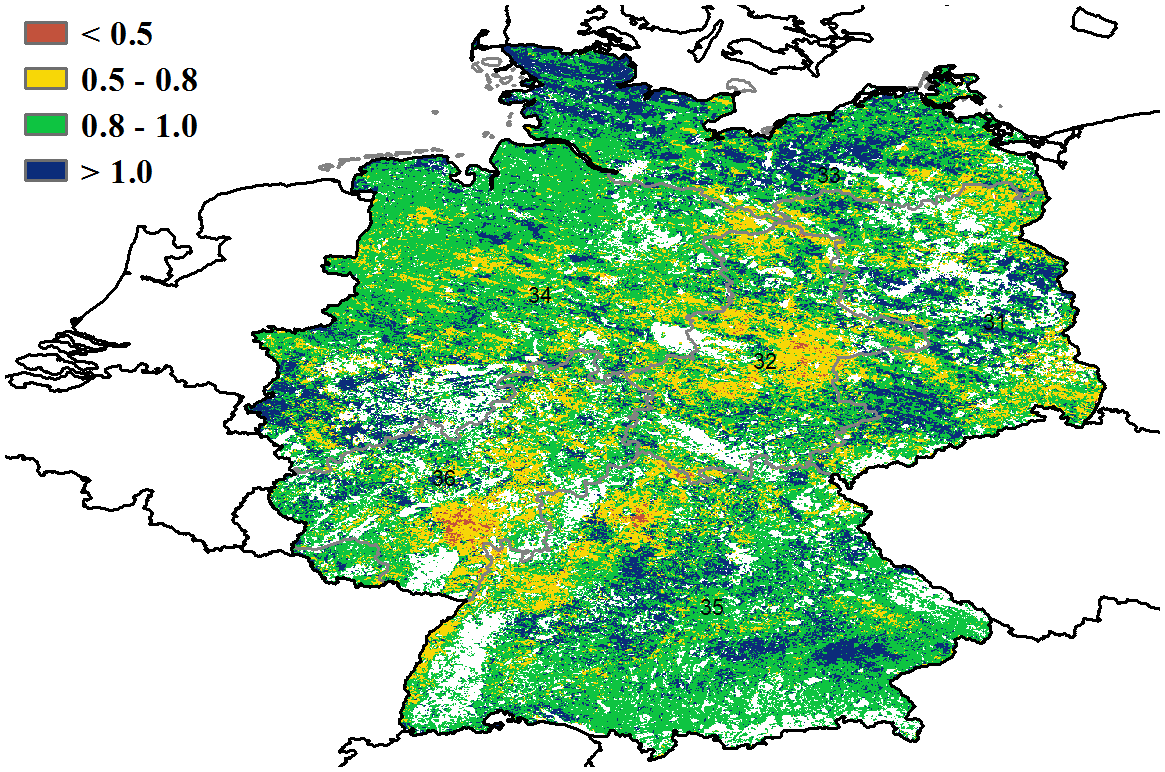
Figure 3.10c. Germany maximum VCI for October 2018-January 2019 by pixel
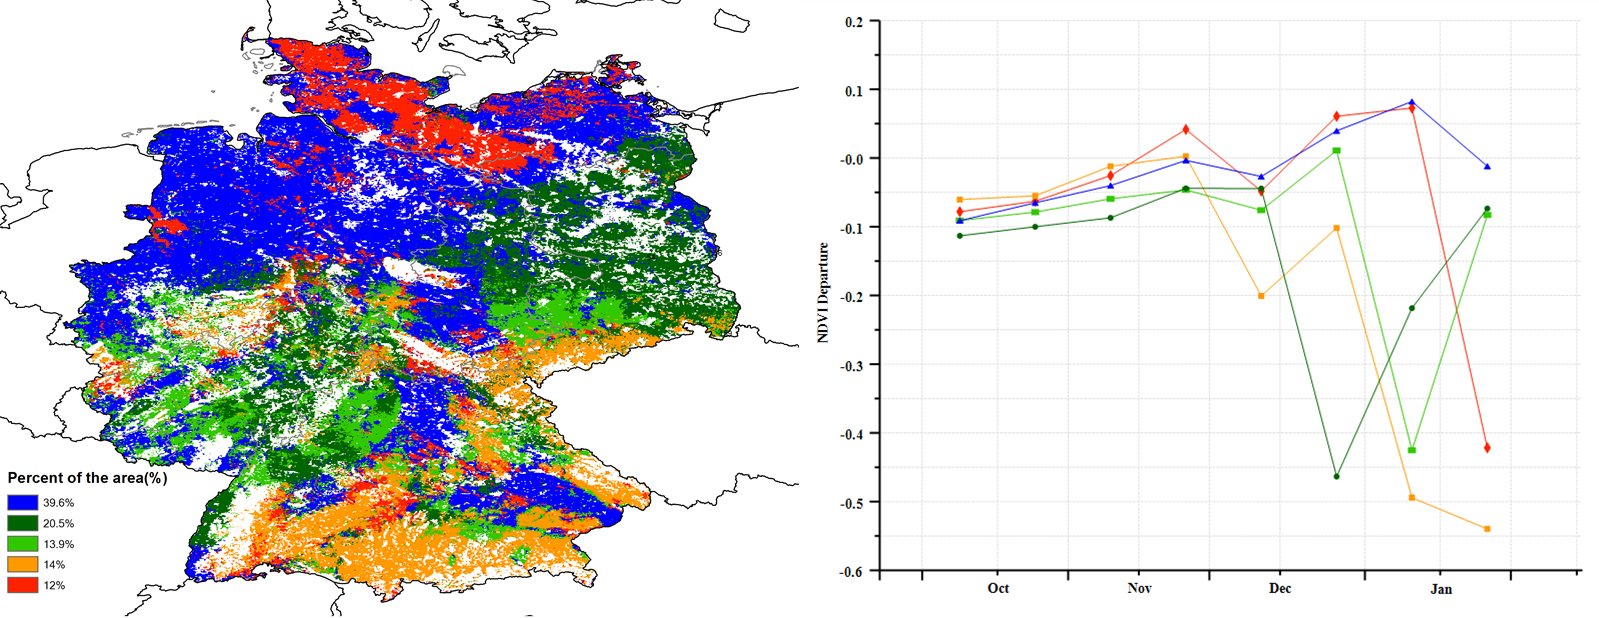
Figure 3.10d. Germany spatial NDVI patterns up to January 2019 according to local cropping patterns and compared to the 5YA (left) and (e) associated NDVI profiles (right)
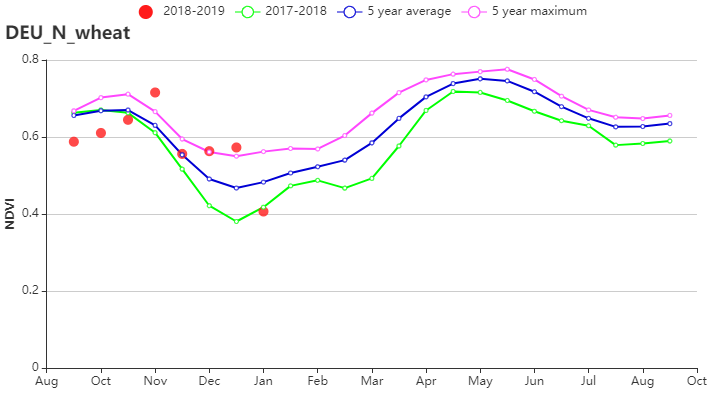
Figure 3.10f. Wheat zone of Schleswig-Holstein and the Baltic coast crop condition development graph based on NDVI
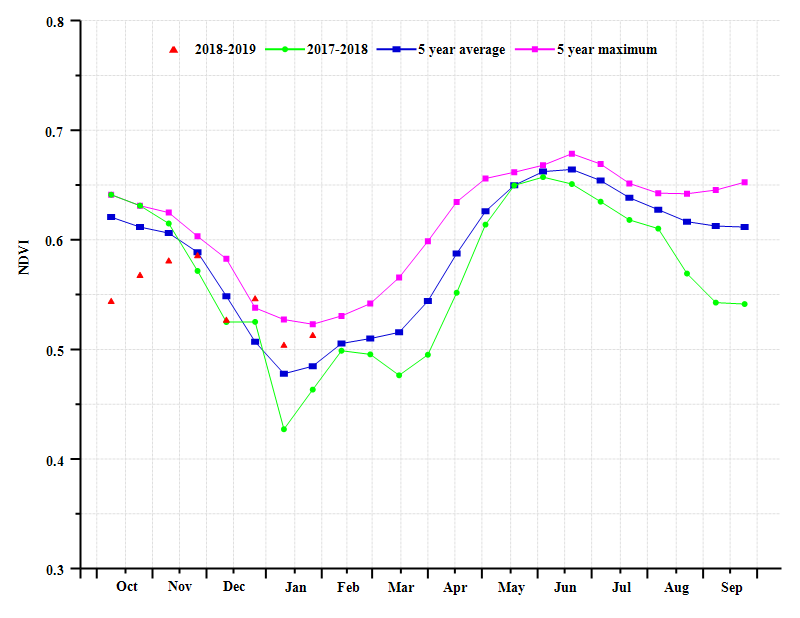
Figure 3.10g. Mixed wheat and sugarbeets zone of the north-west crop condition development graph based on NDVI
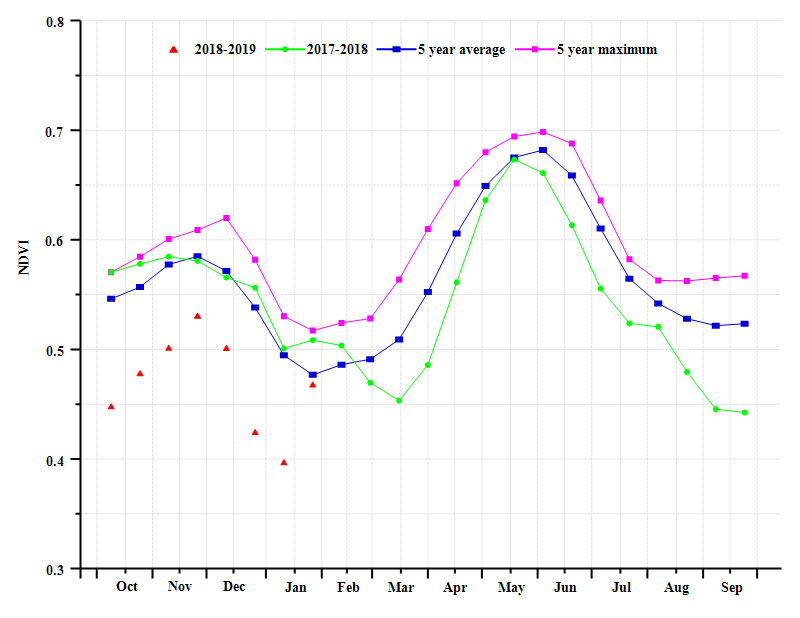
Figure 3.10h. Central wheat zone of Saxony and Thuringia crop condition development graph based on NDVI
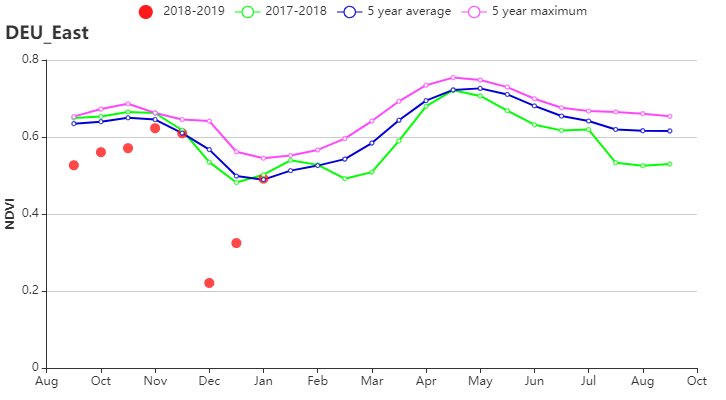
Figure 3.10i. Sparse crop area of the east-German lake and Heathland crop condition development graph based on NDVI
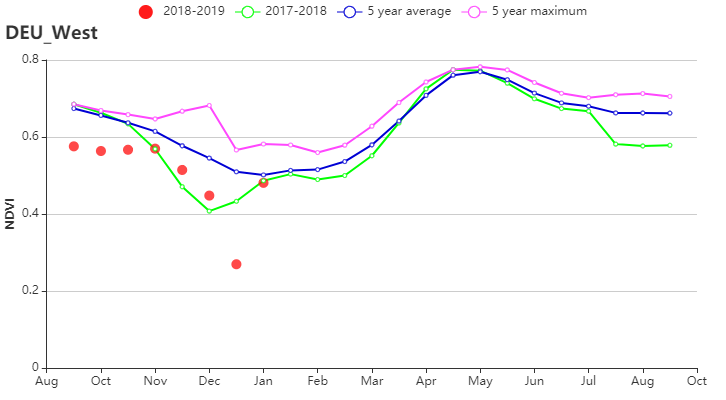
Figure 3.10j. Western sparse crop area of the Rhenish massif crop condition development graph based on NDVI
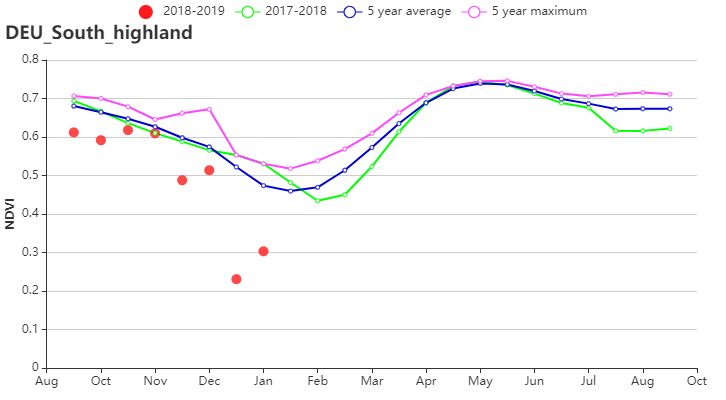
Figure 3.10k. Bavarian Plateau crop condition development graph based on NDVI
Table 3.17. Germany agroclimatic indicators by sub-national regions, current season's values and departure from 15YA, October 2018-January 2019
| Region | RAIN | TEMP | RADPAR | |||
| Current | Departure from 15YA (%) | Current | Departure from 15YA (°C) | Current | Departure from 15YA (%) | |
| (mm) | (°C) | (MJ/m2) | ||||
| Wheat zone of Schleswig-Holstein and the Baltic coast | 266 | -20 | 6.2 | 0.9 | 190 | 9 |
| Mixed wheat and sugarbeets zone of the north-west | 304 | -11 | 6.3 | 0.6 | 214 | 7 |
| Central wheat zone of Saxony and Thuringia | 251 | -11 | 5.5 | 0.7 | 232 | 6 |
| Sparse crop area of the east-German lake and Heathland | 276 | -3 | 5.4 | 1.0 | 229 | 7 |
| Western sparse crop area of the Rhenish massif | 253 | -12 | 5.5 | 0.6 | 243 | 6 |
| Bavarian Plateau | 315 | 8 | 4.2 | 0.6 | 302 | 5 |
| Region | BIOMSS | Cropped arable land fraction | Maximum VCI | ||
| Current (gDM/m2) | Departure from 5YA (%) | Current | Departure from 5YA (%) | Current | |
| (%) | |||||
| Wheat zone of Schleswig-Holstein and the Baltic coast | 1069 | 4 | 100 | 0 | 0.97 |
| Mixed wheat and sugarbeets zone of the north-west | 1089 | 4 | 100 | 0 | 0.91 |
| Central wheat zone of Saxony and Thuringia | 955 | 0 | 99 | -1 | 0.85 |
| Sparse crop area of the east-German lake and Heathland | 1007 | 5 | 99 | 0 | 0.91 |
| Western sparse crop area of the Rhenish massif | 982 | 1 | 95 | -4 | 0.86 |
| Bavarian Plateau | 946 | 6 | 99 | -1 | 0.92 |