 English
 中文
中文
Bulletin
wall bulletinMenu
- Overview
- Country analysis
- Afghanistan
- Angola
- Argentina
- Australia
- Bangladesh
- Belarus
- Brazil
- Canada
- Germany
- Egypt
- Ethiopia
- France
- United Kingdom
- Hungary
- Indonesia
- India
- Iran
- Italy
- Kazakhstan
- Kenya
- Cambodia
- Sri Lanka
- Morocco
- Mexico
- Myanmar
- Mongolia
- Mozambique
- Nigeria
- Pakistan
- Philippines
- Poland
- Romania
- Russia
- Thailand
- Turkey
- Ukraine
- United States
- Uzbekistan
- Viet Nam
- South Africa
- Zambia
- Kyrgyzstan
Authors: 超级管理员 | Edit: liuwenjun
Wheat and barley, the main crops of Australia, are planted mainly from the end of April to July and harvested from October to January. This reporting period covers the complete growing season and the early harvest of wheat and barley. The national NDVI profile shows overall average conditions compared to the last 5-year average. However, the national NDVI was above last year’s.
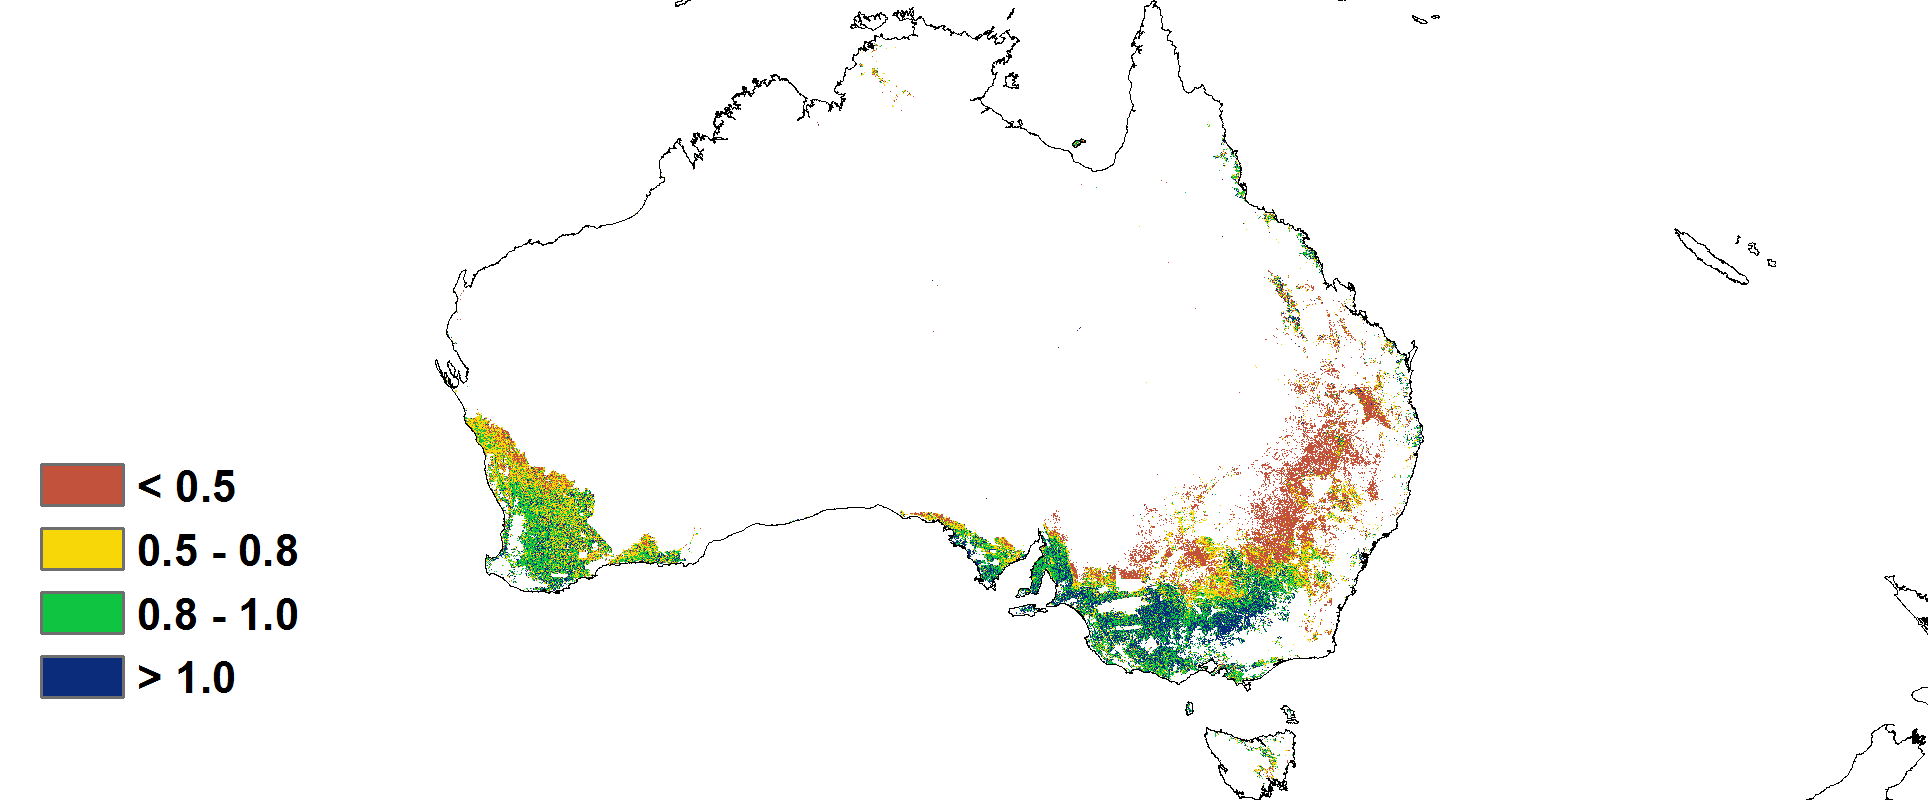
Overall Australia experienced somewhat above-average temperature and 7% above average radiation. Although it suffered from a significant shortfall in rainfall (a 38% drop), the developed irrigation system in the country has provided sufficient water for the crops. The rainfed BIOMSS index increased by 4%. The spatial NDVI profiles show that poor crop conditions prevailed in south-eastern and north-eastern parts of New South Wales and generally corroborate the analyses by agro-ecological regions shown below.
Regional analysis
This analysis uses five agro-ecological regions for Australia, namely the South-eastern wheat zone, South-western wheat zone, Arid and semi-arid zone, Wet temperate and subtropical zone, and Sub-humid subtropical zone.
Crop conditions in the South-eastern wheat zone were basically above average from July to September, although the conditions returned to average in October during the early harvesting stage. The region experienced a 29% deficit of rainfall, with average temperature and RADPAR, resulting in a VCIx of 0.79. CALF decreased by 12%. Output was average and below.
The South-western wheat zone shows average crop conditions according to the regional NDVI profile. The region experienced the least severe rainfall deficit (-28%) among the five agro-ecological regions; radiation (RADPAR) was high (10%) and temperature was 0.5℃ above average. The weather-based potential biomass was 15% higher than its average of the last five years. The CALF only decreased by 4%. The situation here is also reflected by the NDVI cluster maps in the Western Australia region, with a fair VCIx of 0.79.
Crop condition based on NDVI profiles was below average in the Arid and Semi-arid zone. The region experienced a 47% rainfall deficit with average temperature and RADPAR, resulting in a low VCIx of 0.59. Furthermore, the CALF decreased by 11% indicating a reduction of the cropped area and production.
In the Wet Temperate and Subtropical Zone crop condition was above average according to the regional NDVI profile. Although the region was 34% deficient in rainfall (with average temperature and radiation), the irrigation infrastructure has supplemented enough water to the crops. As a result, the VCIx finally reached 0.76 with CALF reaching 88%, indicating average to above average crop condition.
The Sub-humid subtropical zone showed apparently below average condition during the monitored period based on NDVI. The region was 72% deficient in rainfall, with average temperature and RADPAR. Furthermore, the region experienced a sharply decreased CALF (-61%) and CI (-51%), indicating a marked decrease of the cropped area. With VCIx reaching just 0.33, crop prospects are assessed as poor.
Figure 3.6. Australia crop condition, July 2019-October 2019
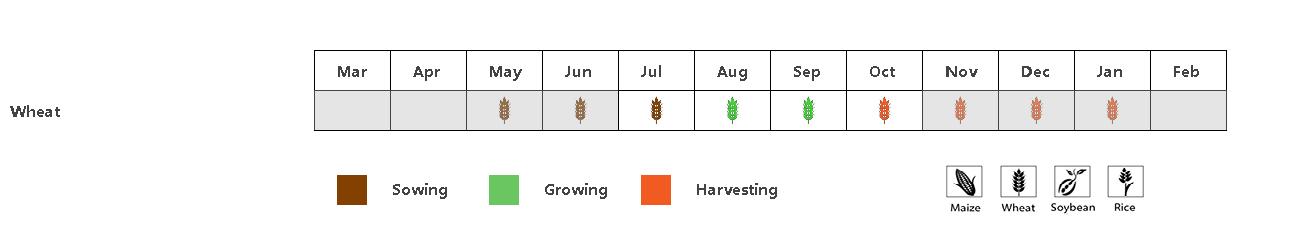
(a).Phenology of major crops
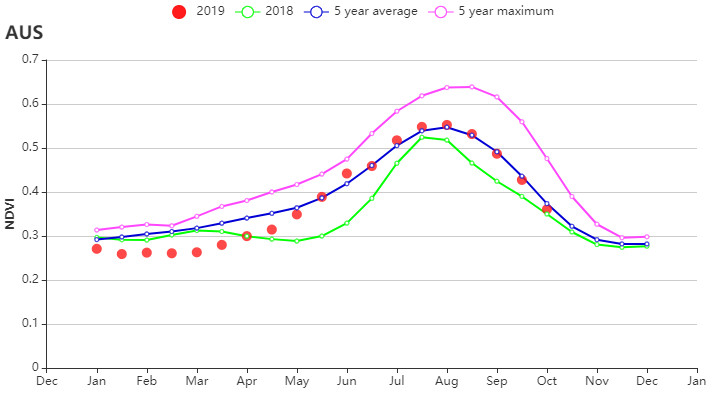
(b)Crop condition development graph based on NDVI (c) Maximum VCI
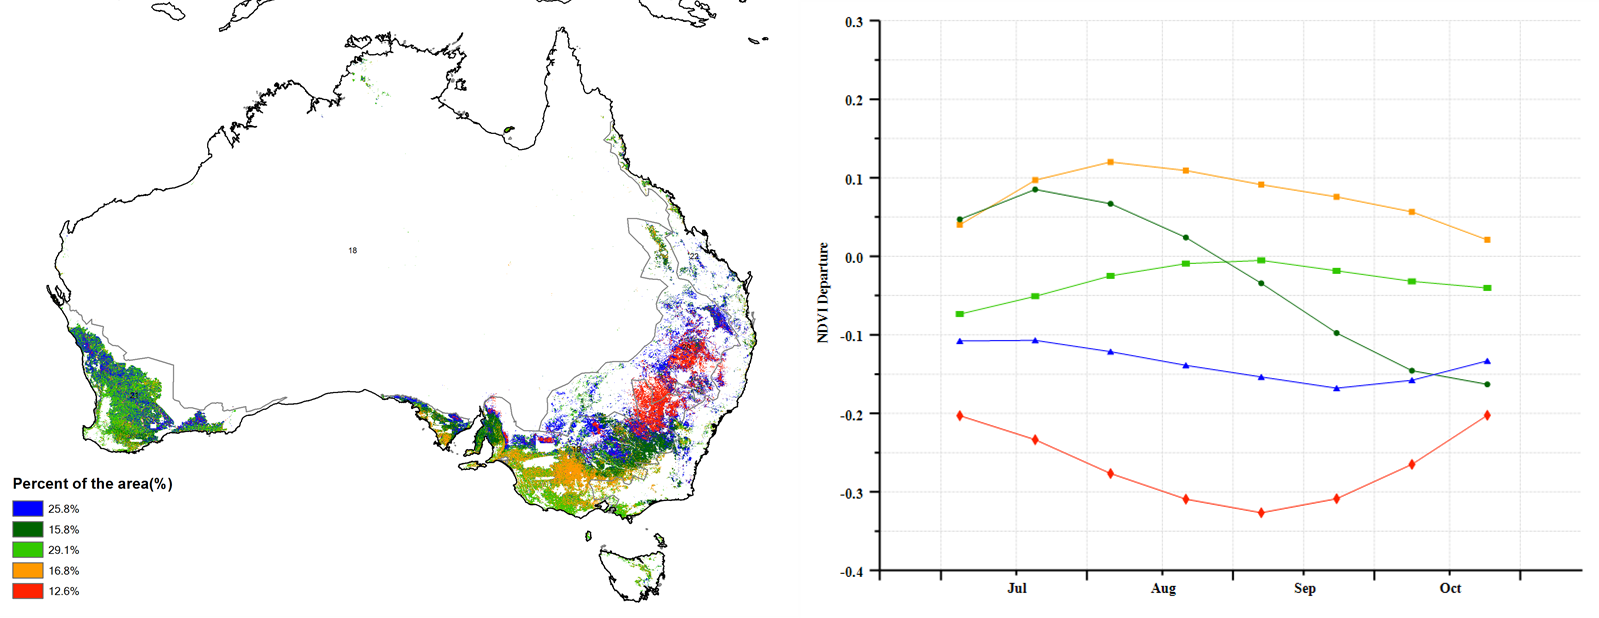
(d)Spatial NDVI patterns compared to 5YA (e)NDVI profiles
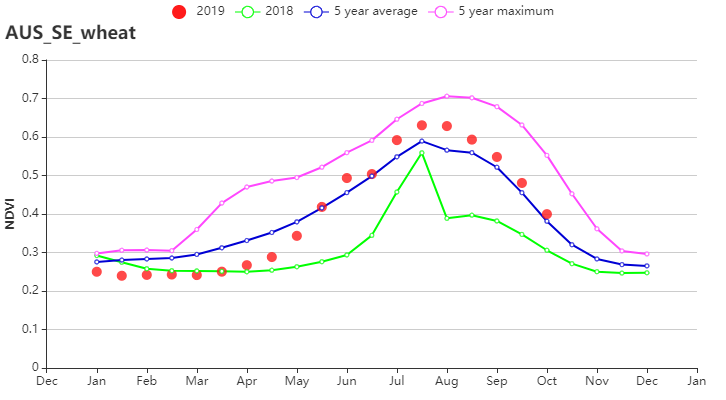
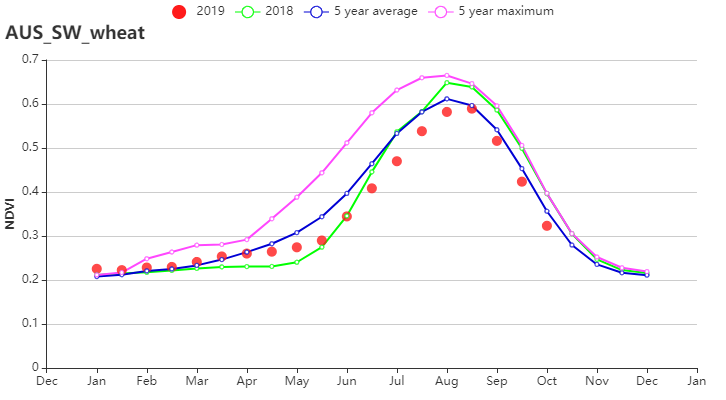
(f)Crop condition development graph based on NDVI for the Southeastern wheat zone (left) and Southwestern wheat zone (right)
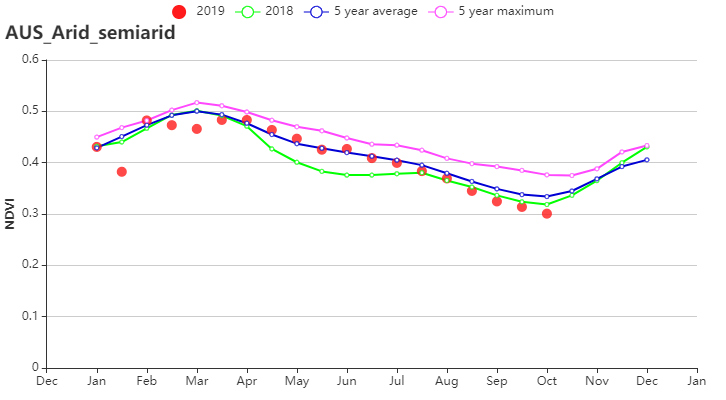
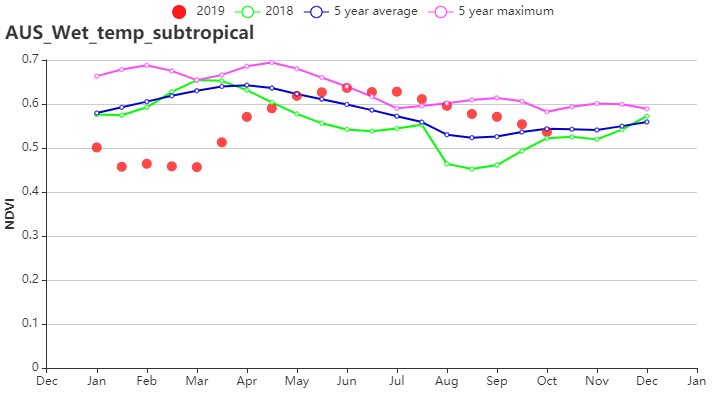
(g)Crop condition development graph based on NDVI for the Arid and semi-arid zone (left) and Wet temperate and subtropical zone (right)
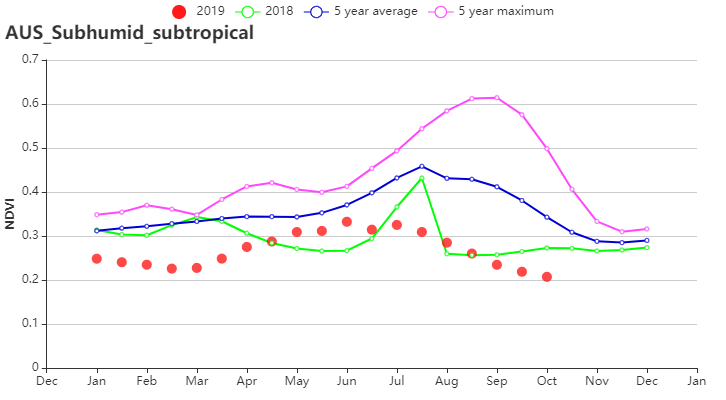
(h)Crop condition development graph based on NDVI for the Subhumid subtropical zone
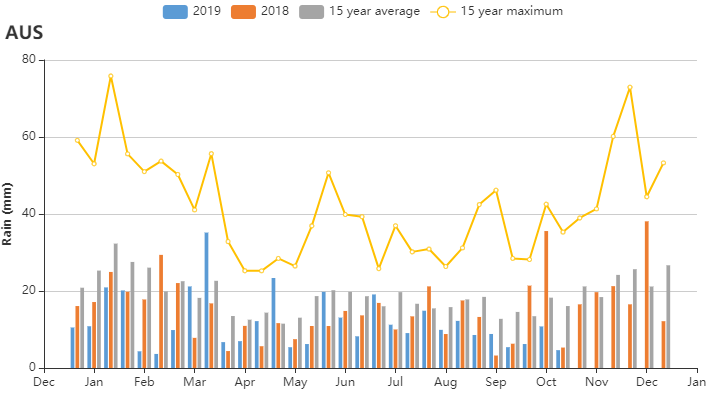
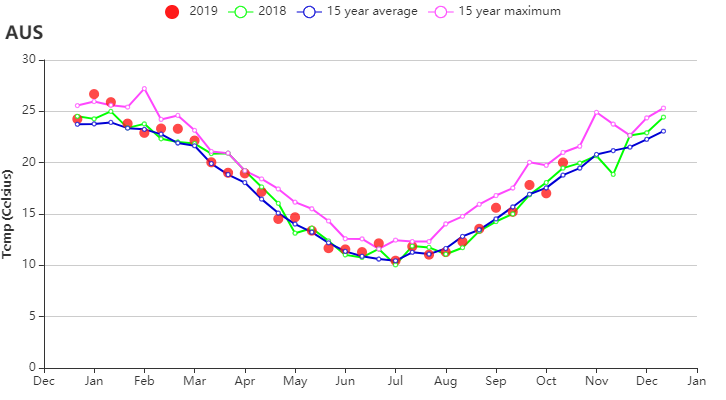
(i)Time series rainfall profile (left) and temperature profile (right))
| Region | RAIN | TEMP | RADPAR | BIOMSS | ||||
| Current (mm) | Departure from 15YA (%) | Current (°C) | Departure from 15YA (°C) | Current (MJ/m2) | Departure from 15YA (%) | Current (gDM/m2) | Departure from 15YA (%) | |
| Arid and semiarid zone | 30 | -47 | 23.3 | -0.4 | 1349 | 7 | 294 | -26 |
| Southeastern wheat area | 147 | -29 | 12.1 | 0.1 | 865 | 3 | 323 | 9 |
| Subhumid subtropical zone | 42 | -72 | 16.1 | 0.8 | 1150 | 8 | 400 | -3 |
| Southwestern wheat area | 171 | -28 | 13.3 | 0.5 | 934 | 10 | 356 | 15 |
| Wet temperate and subtropical zone | 146 | -34 | 13.3 | 0.1 | 1017 | 7 | 350 | 1 |
Table 3.6.Australia agronomic indicators by sub-national regions, current season's values and departure from 15YA/5YA, July 2019-October 2019
| Region | Cropped arable land fraction | Cropping Intensity | Maximum VCI | ||
| Current (%) | Departure from 5YA (%) | Current (%) | Departure from 5YA (%) | Current | |
| Arid and semiarid zone | 47 | -11 | 77 | -2 | 0.59 |
| Southeastern wheat area | 83 | -12 | 79 | -11 | 0.79 |
| Subhumid subtropical zone | 24 | -61 | 32 | -51 | 0.33 |
| Southwestern wheat area | 87 | -4 | 80 | -8 | 0.79 |
| Wet temperate and subtropical zone | 88 | -8 | 111 | -6 | 0.76 |