 English
 中文
中文
Bulletin
wall bulletinMenu
- Overview
- Country analysis
- Afghanistan
- Angola
- Argentina
- Australia
- Bangladesh
- Belarus
- Brazil
- Canada
- Germany
- Egypt
- Ethiopia
- France
- United Kingdom
- Hungary
- Indonesia
- India
- Iran
- Italy
- Kazakhstan
- Kenya
- Cambodia
- Sri Lanka
- Morocco
- Mexico
- Myanmar
- Mongolia
- Mozambique
- Nigeria
- Pakistan
- Philippines
- Poland
- Romania
- Russia
- Thailand
- Turkey
- Ukraine
- United States
- Uzbekistan
- Viet Nam
- South Africa
- Zambia
- Kyrgyzstan
Authors: 超级管理员 | Edit: gaoww
This reporting period for Germany covers the late stages of sugar beets (October harvest) and early vegetative stages of winter wheat and winter barley.
At the national level, total precipitation was 5% below average, temperature was significantly above average (TEMP, +1.2°C), and radiation was average. Above average precipitation occurred in most of Germany from early-October to mid-October, early-November and mid-December. This was favorable for winter crop planting and establishment. Negative rainfall departures occurred during short periods in late October, late November and after late December. Most parts of Germany experienced warmer-than-usual conditions during this reporting period, except early-October and in mid-November, when a cold spell swept through most European countries. Due to favorable rainfall early in the monitoring period and overall warmer-than-usual conditions, the biomass production potential (BIOMSS) is expected to increase by 1% nationwide compared to the five-year average.
According to the national crop condition development graph, the reporting period experienced crop condition that was better than in 2019. As compared to the 5-year average, it was worse until November, but increased to above average in December and exceeded the 5-year maximum in January 2020. These observations are confirmed by the spatial NDVI profiles. Crop condition was above average in October on only 41.4% of the cropland, and improved to 55.1% in December and 92% in January, because of warmer-than-usual temperatures. The large negative outliers are probably due to fog, snow, clouds or other factors. Overall, the above-mentioned pattern of crop growth is also reflected by VCIx. Its value reached 0.95 country wide. CALF during the reporting period was the same as the recent five-year average.
Generally, the values of agroclimatic and agronomic indicators mentioned above show favorable conditions for most winter crops and the outlook of winter crops is above average.
Regional analysis
Based on cropping systems, climatic zones, and topographic conditions, six sub-national regions can be distinguished for Germany. The ones which are most relevant for crop cultivation are the Northern wheat zone, North-west mixed wheat and sugar beets zone, and the Central wheat zone.
Schleswig-Holstein and the Baltic coast is the major winter wheat zone of Germany. The CropWatch agroclimatic indicators RAIN (+5%) and temperature (TEMP, +1.3°C) were above average, whereas radiation (RADPAR, -4%) was below. Due to unfavorable sunshine, biomass (BIOMSS) in this zone was decreased by 1% as compared to the five-year average. As shown in the crop condition development graph based on NDVI, the values were below or close to average in October, and below average from November to December, then above average in January 2020. The area had a high CALF (100%) as well as a favorable VCIx (0.94), indicating a larger cropped area.
Wheat and sugar-beets are major crops in the Mixed wheat and sugar-beets zone of the north-west. The CropWatch agroclimatic indicator RAIN was average with warm weather (TEMP +1.0°C) and radiation below average (RADPAR, -2%), which led to a small decrease (-2%) of BIOMSS. As shown in the crop condition development graph based on NDVI, the NDVI values and crop condition was above the situation in 2019 until late-October, then below average in November, while after early-December, it was average, and even above the 5-year maximum in January 2020. The area had a high CALF (100%) and a high VCIx (0.96), indicating favorable crop prospects.
The Central wheat zone of Saxony and Thuringia is another major winter wheat zone; The CropWatch agroclimatic indicator show that this region experienced a precipitation deficit (-13%) with warm weather (TEMP, +1.5°C) and radiation above average (RADPAR, +6%). With suitable temperature, biomass (BIOMSS) in this zone is expected to increase by 7% compared to the five-year average. As shown in the crop condition development graph based on NDVI, the values were higher than in 2019 from October to November, and above the 5-year maximum after December. The area has a high CALF (100%) as well as a favorable VCIx (0.95), indicating favorable crop prospects.
The East-German lake and Heathland sparse crop area experienced rainfall deficit (RAIN, -6%) but with above average temperature (TEMP, +1.6°C), average radiation (RADPAR, +4%) and above average BIOMSS (+8%). NDVI values were average until late-November, and then increased to above 5-year maximum by late December. The area had a high CALF (100%) and a high VCIx (0.96).
The cropland in the Western sparse crop area of the Rhenish massif was more marginal. It recorded about 4% above average rainfall, with warm weather (TEMP +1.0°C) and radiation below average (RADPAR, -7%), which led to a decrease of BIOMSS (-9%). As shown in the crop condition development graph based on NDVI, the NDVI values and crop condition were similar to the other regions, and showed above the situation in 2019 until late-October, then below average in November, while after early-December, it was average, and even above the 5-year maximum in January 2020. The area had high CALF (100%) and a high VCIx (0.91).
Dry weather was recorded in the Bavarian Plateau (RAIN -9%), with above average temperatures (+1.1°C) and radiation (RADPAR +1%). Compared to the five-year average, BIOMSS increased 2%. The area had a high CALF (100%) as well as a favorable VCIx (0.95). As shown in the crop condition development graph based on NDVI, the values were all above the situation in 2019 and average during the whole reporting period, except November, showing favorable crop prospects for the regions.
Figure 3.15. Germany’s crop condition, October 2019-January 2020
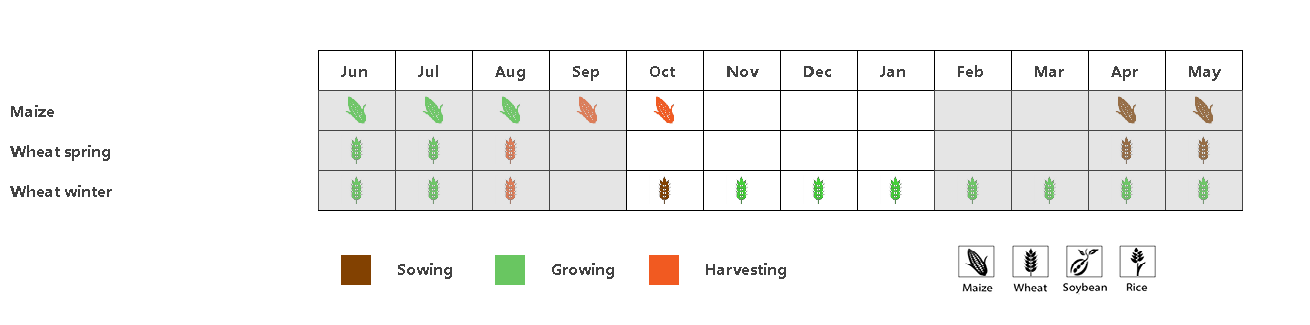
Figure 3.10a. Germany phenology of major crops

Figure 3.15b. Germany national level crop condition development graph based on NDVI, comparing the October 2019-January 2020 period to the previous season and the five-year average (5YA) and maximum
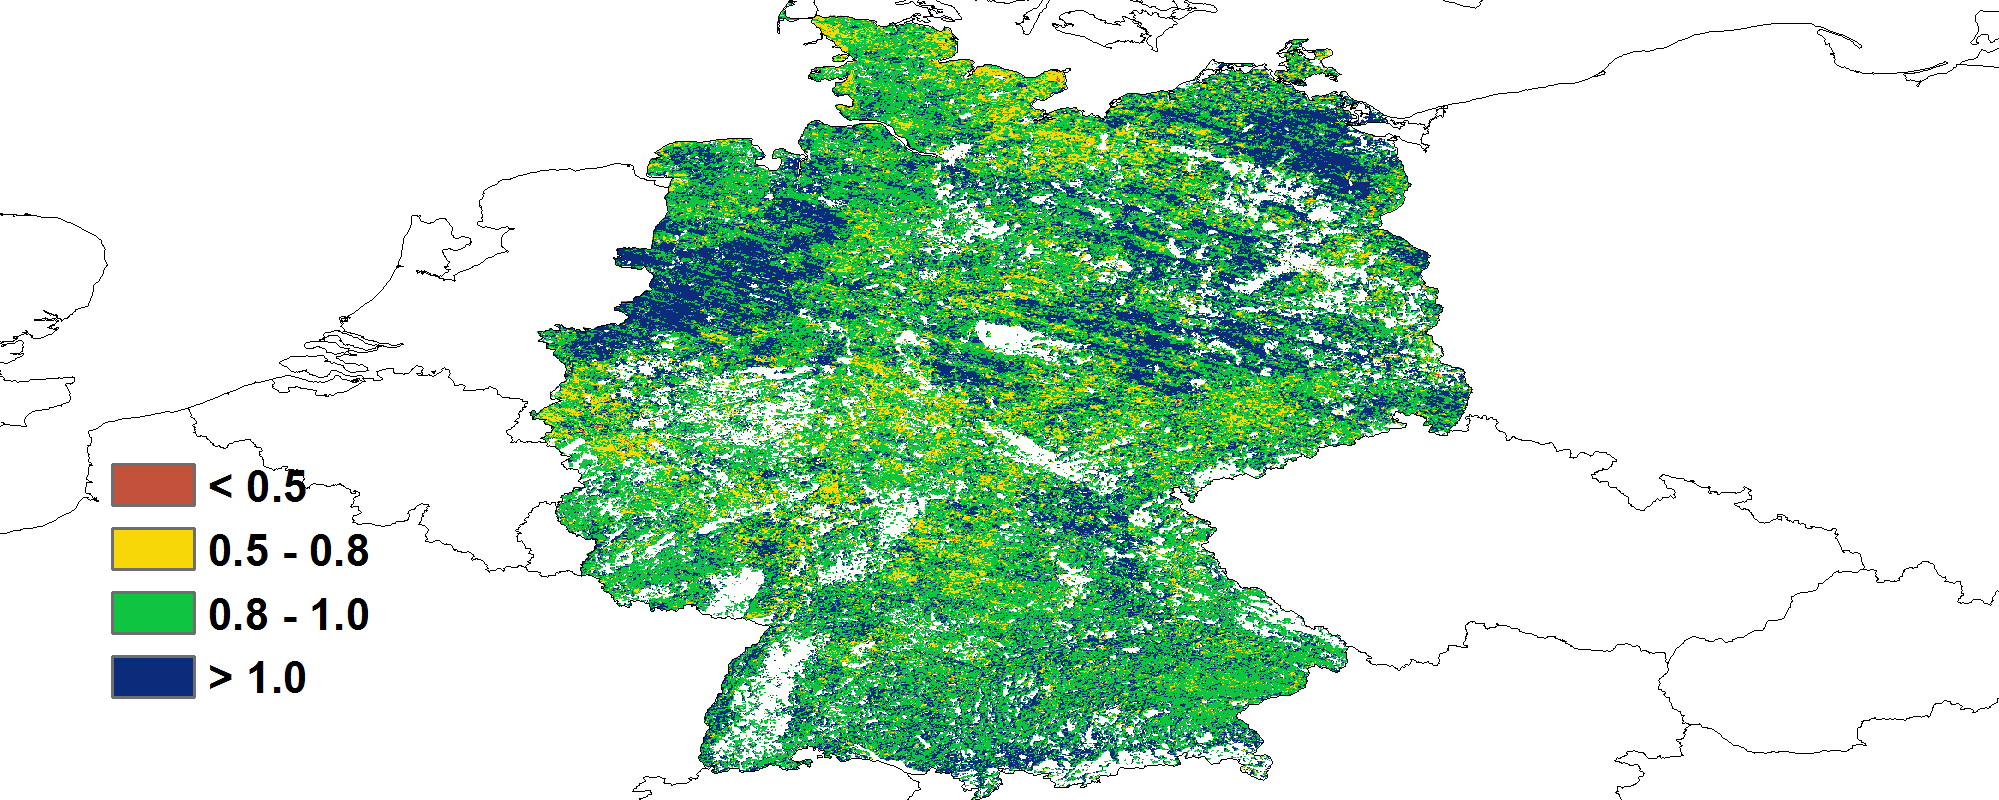
Figure 3.15c. Germany maximum VCI for October 2019-January 2020 by pixel

Figure 3.15d. Germany spatial NDVI patterns up to January 2020 according to local cropping patterns and compared to the 5YA (left) and (e) associated NDVI profiles (right)


Figure 3.15e. Time series rainfall pofile (left) and temperature pofile (right) of Germany comparing the October 2019-January 2020 period to the previous season and the five-year average (5YA) and maximum
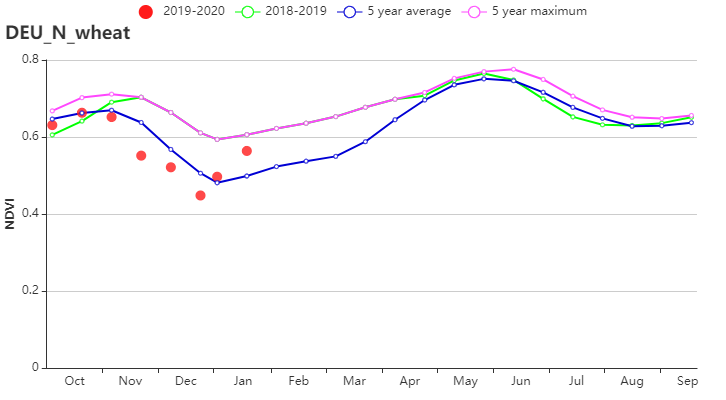


Figure 3.15f. Wheat zone of Schleswig-Holstein and the Baltic coast crop condition development graph based on NDVI (left), time series rainfall profile (middle) and time series temperature profile (right)


Figure 3.15g. Mixed wheat and sugarbeets zone of the north-west crop condition development graph based on NDVI (left), time series rainfall profile (middle) and time series temperature profile (right)

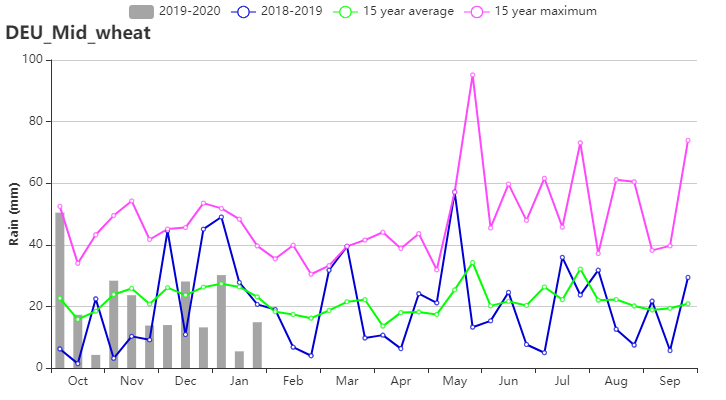

Figure 3.15h. Central wheat zone of Saxony and Thuringia crop condition development graph based on NDVI (left), time series rainfall profile (middle) and time series temperature profile (right)


Figure 3.15i. East-German lake and Heathland sparse crop area crop condition development graph based on NDVI (left), time series rainfall profile (middle) and time series temperature profile (right)

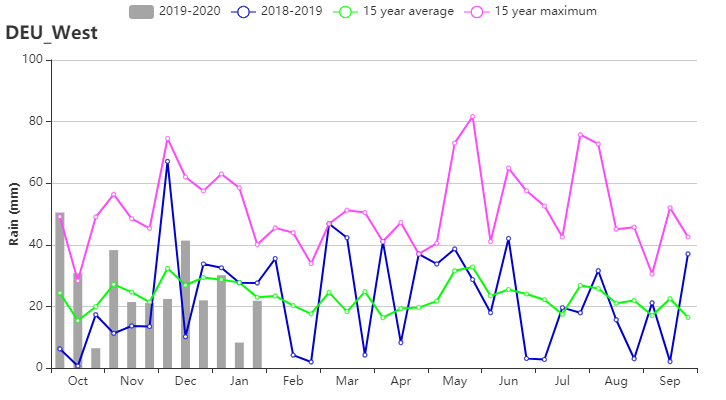

Figure 3.15j. Western sparse crop area of the Rhenish massif crop condition development graph based on NDVI (left), time series rainfall profile (middle) and time series temperature profile (right)
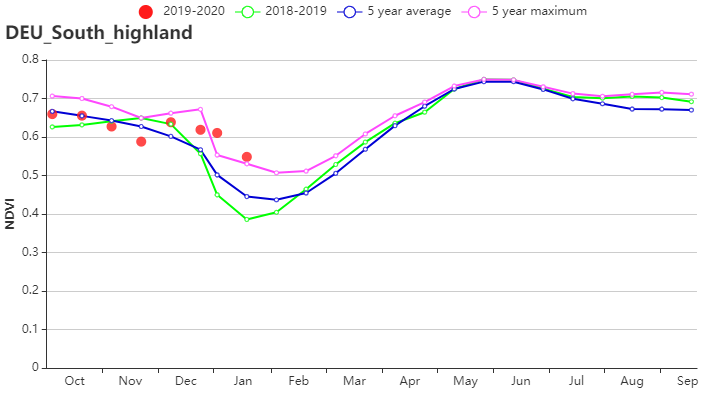


Figure 3.15k. Bavarian Plateau crop condition development graph based on NDVI (left), time series rainfall profile (middle) and time series temperature profile (right)
Table 3.17. Germany agro-climatic indicators by sub-national regions, current season's values and departure from 15YA, October 2019-January 2020
| Region | RAIN | TEMP | RADPAR | |||
| Current | Departure from 15YA (%) | Current | Departure from 15YA (°C) | Current | Departure from 15YA (%) | |
| (mm) | (°C) | (MJ/m2) | ||||
| Wheat zone of Schleswig-Holstein and the Baltic coast | 349 | 5 | 6.4 | 1.3 | 169 | -4 |
| Mixed wheat and sugarbeets zone of the north-west | 340 | 0 | 6.2 | 1.0 | 196 | -2 |
| Central wheat zone of Saxony and Thuringia | 243 | -13 | 5.3 | 1.5 | 232 | 6 |
| East-German lake and Heathland sparse crop area | 228 | -20 | 5.6 | 1.6 | 222 | 4 |
| Western sparse crop area of the Rhenish massif | 314 | 4 | 5.1 | 1.0 | 213 | -7 |
| Bavarian Plateau | 345 | -9 | 4.2 | 1.1 | 291 | 1 |
Table 3.18. Germany agronomic indicators by sub-national regions, current season's value and departure from 5YA/15YA, October 2019-January 2020
| Region | BIOMSS | Cropped arable land fraction | Maximum VCI | ||
| Current | Departure from 15YA (%) | Current | Departure from 5YA (%) | Current | |
| (gDM/m2) | (%) | ||||
| Wheat zone of Schleswig-Holstein and the Baltic coast | 43 | -1 | 100 | 0 | 0.94 |
| Mixed wheat and sugarbeets zone of the north-west | 49 | -2 | 100 | 0 | 0.96 |
| Central wheat zone of Saxony and Thuringia | 56 | 7 | 100 | 0 | 0.95 |
| East-German lake and Heathland sparse crop area | 54 | 8 | 100 | 0 | 0.96 |
| Western sparse crop area of the Rhenish massif | 50 | -9 | 100 | 1 | 0.91 |
| Bavarian Plateau | 64 | 2 | 100 | 0 | 0.95 |