 English
 中文
中文
Bulletin
wall bulletinMenu
- Overview
- Country analysis
- Afghanistan
- Angola
- Argentina
- Australia
- Bangladesh
- Belarus
- Brazil
- Canada
- Germany
- Egypt
- Ethiopia
- France
- United Kingdom
- Hungary
- Indonesia
- India
- Iran
- Italy
- Kazakhstan
- Kenya
- Cambodia
- Sri Lanka
- Morocco
- Mexico
- Myanmar
- Mongolia
- Mozambique
- Nigeria
- Pakistan
- Philippines
- Poland
- Romania
- Russia
- Thailand
- Turkey
- Ukraine
- United States
- Uzbekistan
- Viet Nam
- South Africa
- Zambia
- Kyrgyzstan
Authors: 超级管理员 | Edit: yannn
During January to April, the harvest of rainy season maize was completed in Java and Sumatra, while the main rice harvest started in March. According to the agroclimatic indicators, Indonesia experienced favorable weather conditions: radiation (RADPAR, +5%) and temperature (TEMP +0.4°C) were slightly above average, accompanied with average rainfall (RAIN, +1%), all of which led to a slightly increased biomass production potential (+ 4%). Nationwide, the crop conditions were below average according to the NDVI development graph as compared to the recent five-year average. Considering the favorable VCIx value of 0.96, the crop condition shown in the NDVI development graph may be somewhat underestimated. According to the NDVI profiles, crop condition in 48.7% of arable land distributed in the patches around Indonesia was slightly above average before March. However, it deteriorated to somewhat below average after that, which may result from the advance of harvest during this monitoring period. The crop condition for the rest of arable land was below average during the whole monitoring period, especially the area in 12.3% of total arable land (marked as blue) located in Sumatera Utara, Riau, Sumatera Selatan, and Bengkulu. However, BIOMSS production, CALF and VCIx were positive and we expect a slightly higher than average production.
Regional analysis
The analysis below focuses on four agro-ecological zones. The most relevant ones for crop cultivation are Sumatra (92), Java (90, the main agricultural region in the country), Kalimantan and Sulawesi (91). West Papua (93) is the least important one. The numbers correspond to the labels in the VCIx and NDVI profile maps.
According to the agroclimatic conditions of Java, rainfall (RAIN +2%), radiation (RADPAR +6%) and temperature (TEMP +0.5℃) were slightly above average, resulting in a rise of the biomass production potential (BIOMSS +6%). According to the NDVI development graph, crop condition was below the 5-year average before March and subsequently improved to average levels in April. However, considering the average CALF and favorable VCIx value of 0.94, crop production in Java is likely to be average or even slightly above average.
The agro-climatic conditions of Kalimantan and Sulawesi follow the same patterns as the country as a whole: accumulated rainfall (RAIN +3%), temperature (TEMP +0.4℃ ) and radiation (RADPAR +5%) were above average, leading to a 4% increase of the biomass production potential. According to the NDVI development graph, crop condition was slightly below the 5-year average. Considering the favorable VCIx value of 0.97, the crop condition shown in the NDVI development graph may be underestimated. The fraction of cropped arable land (CALF) was near average as compared to the 5YA. Altogether crop production is estimated as average.
Temperature (TEMP +0.5 °C) and radiation (RADPAR +5%) was slightly above average in Sumatra, while rainfall (RAIN, -3%) was just below average, leading to a small increase of the biomass production potential (BIOMSS +4%). As shown in the NDVI development graph, crop condition was below the 5-year average. Considering the favorable VCIx value of 0.96 and the average condition of CALF, crop condition and production may be close to or even slightly higher than average.

Figure 3.15a. Indonesia phenology of major crops
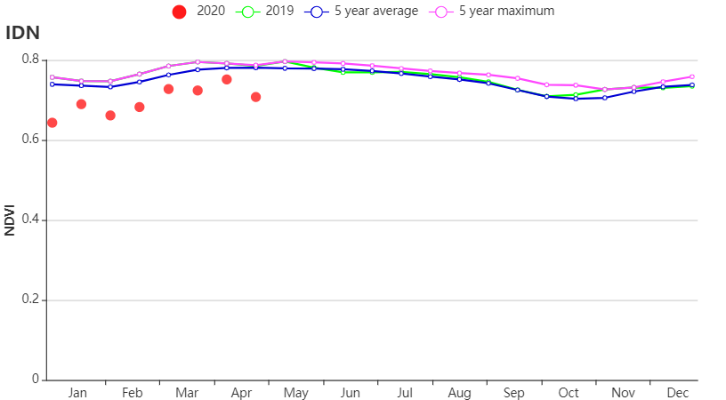
Figure 3.15b. Indonesia national level crop condition development graph based on NDVI, comparing the January-April 2020 period to the previous season and the five-year average (5YA) and maximum
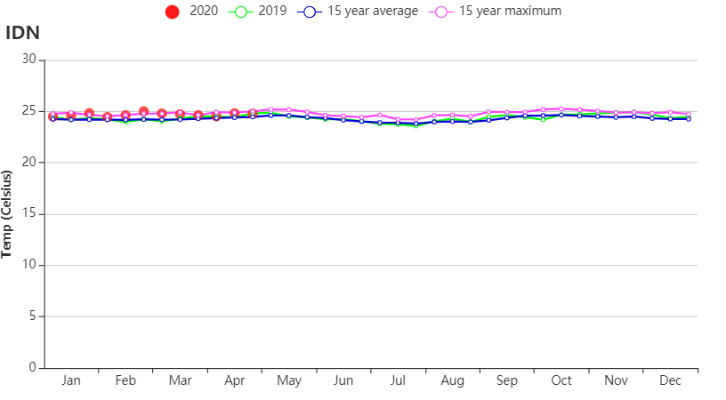
Figure 3.15c. Time series temperature profile in Indonesia

Figure 3.15d. Time series rainfall profile in Indonesia
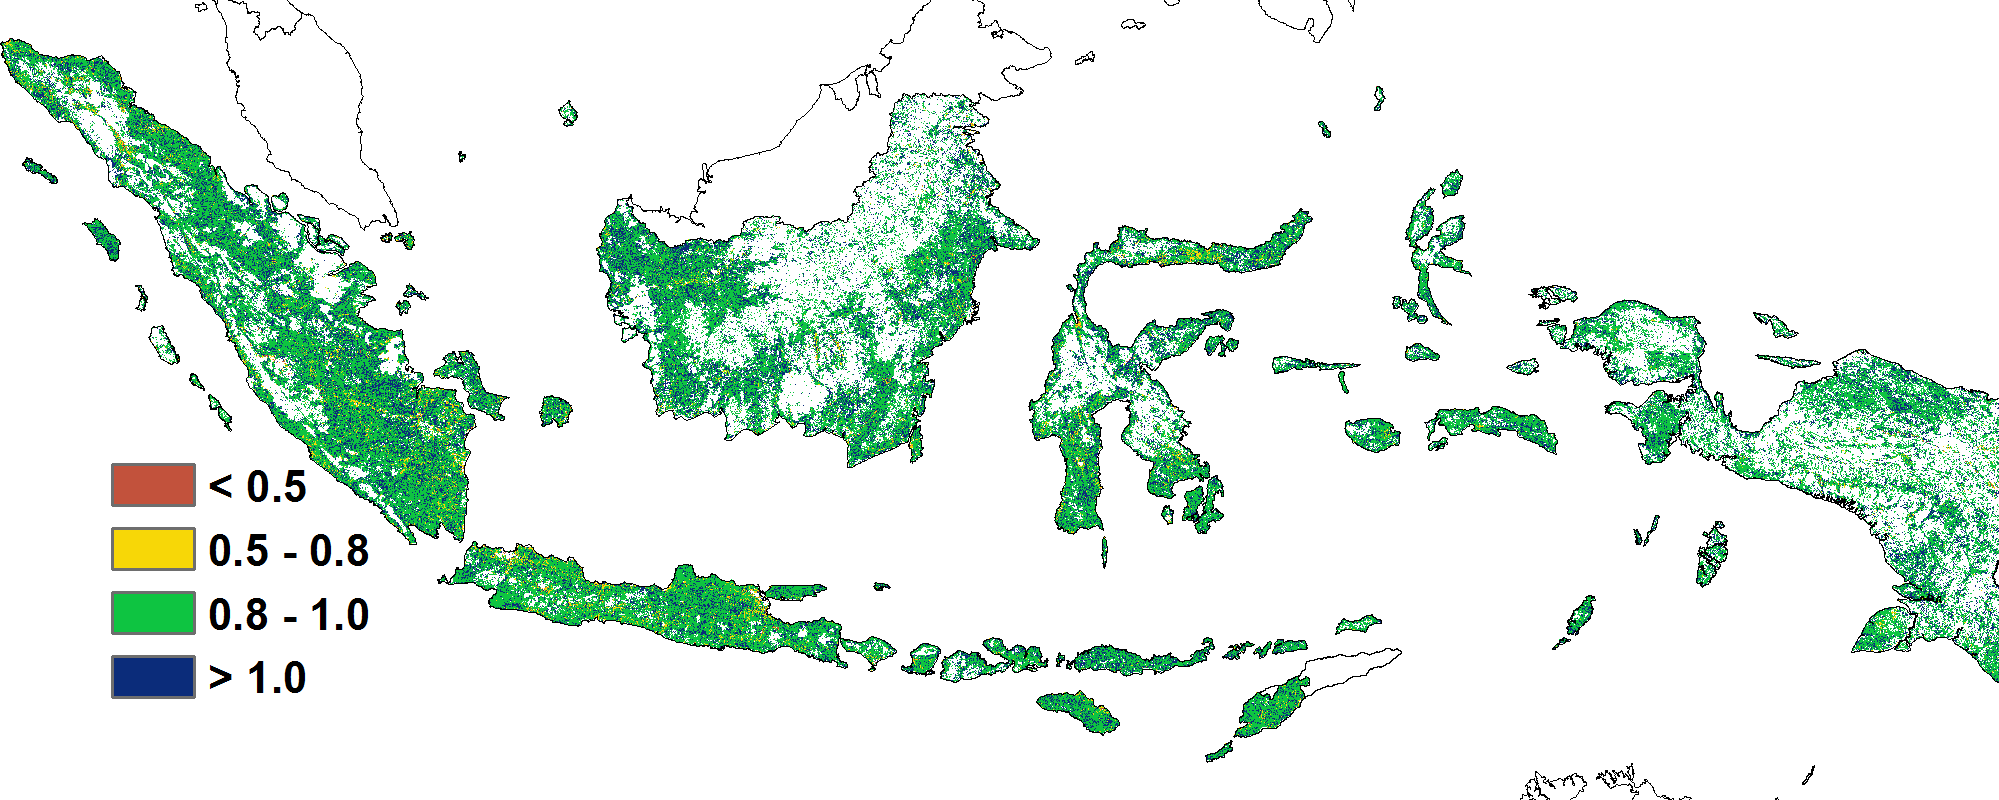
Figure 3.15e. Indonesia VCI for January-April 2020 by pixel
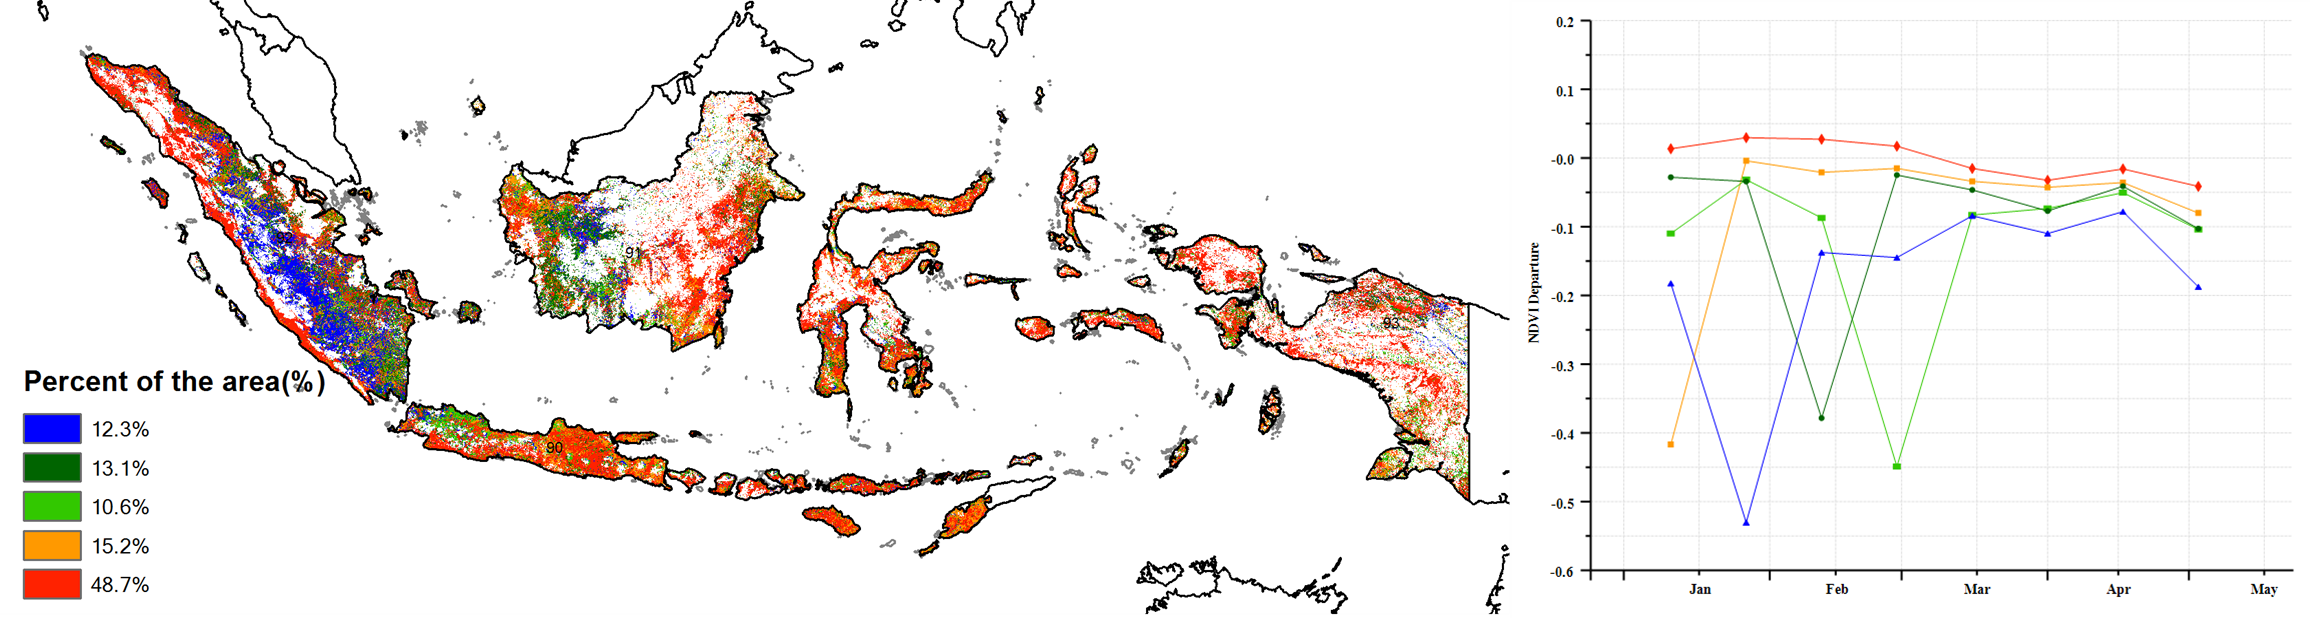
Figure 3.15f. Indonesia spatial NDVI patterns up to April 2020 according to local cropping patterns and compared to the 5YA (left) and (e) associated NDVI profiles (right)
![]()
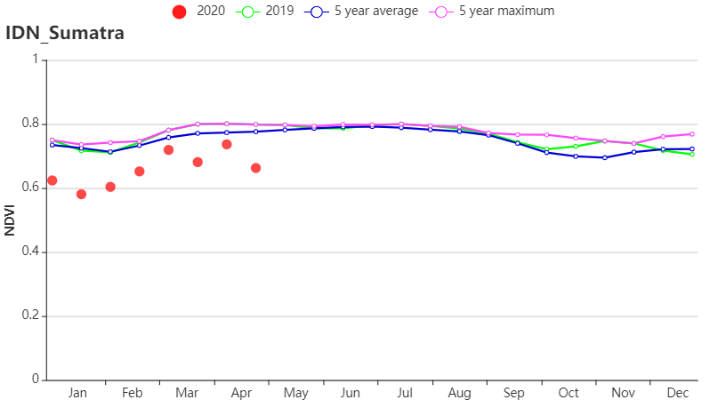
Figure 3.15g. Sumatra crop condition development graph based on NDVI

Figure 3.15h. Java crop condition development graph based on NDVI

Figure 3.15i. Kalimantan and Sulawesi crop condition development graph based on NDVI
Table 3.32. Indonesia agroclimatic indicators by sub-national regions, current season's values and departure from15YA, January-April 2020
| Region | RAIN | TEMP | RADPAR | |||
| Current (mm) | Departure (%) | Current (°C) | Departure (%) | Current (MJ/m2) | Departure (%) | |
| Java | 1353 | 2 | 25.5 | 0.5 | 1256 | 6 |
| Kalimantan and Sulawesi | 1360 | 3 | 24.9 | 0.4 | 1177 | 5 |
| Sumatra | 1289 | -3 | 24.8 | 0.5 | 1162 | 5 |
| West Papua | 1704 | 0 | 23.9 | 0.5 | 1036 | 4 |
Table 3.33. Indonesia agronomic indicators by sub-national regions, current season's value and departure from 15YA/5YA, January-April 2020
| Region | BIOMSS | Cropped arable land fraction | Maximum VCI | ||
| Current (gDM/m2) | Departure (%) | Current | Departure (%) | Current | |
| Java | 859 | 6 | 99 | 0 | 0.94 |
| Kalimantan and Sulawesi | 784 | 4 | 99 | 0 | 0.97 |
| Sumatra | 774 | 4 | 99 | 0 | 0.96 |
| West Papua | 682 | 3 | 100 | 0 | 0.97 |