 English
 中文
中文
Bulletin
wall bulletinMenu
- Overview
- Country analysis
- Afghanistan
- Angola
- Argentina
- Australia
- Bangladesh
- Belarus
- Brazil
- Canada
- Germany
- Egypt
- Ethiopia
- France
- United Kingdom
- Hungary
- Indonesia
- India
- Iran
- Italy
- Kazakhstan
- Kenya
- Cambodia
- Sri Lanka
- Morocco
- Mexico
- Myanmar
- Mongolia
- Mozambique
- Nigeria
- Pakistan
- Philippines
- Poland
- Romania
- Russia
- Thailand
- Turkey
- Ukraine
- United States
- Uzbekistan
- Viet Nam
- South Africa
- Zambia
- Kyrgyzstan
Authors: 超级管理员 | Edit: yannn
Winter wheat is the main crop that is grown during this monitoring period between January and April. It is planted at all latitudes in the United States. Therefore, phenological stages can vary greatly between the north and the south. In the northern regions, wheat reached stem elongation and flowering stage in the south by the end of April. This month also marks the beginning of the sowing period for maize, soybean and rice. In general, the crop conditions are average. Wheat conditions were favorable. But the growth conditions for wheat in the northern part of the Southern Great Plains and Northwest Pacific should be closely watched during the next reporting period.
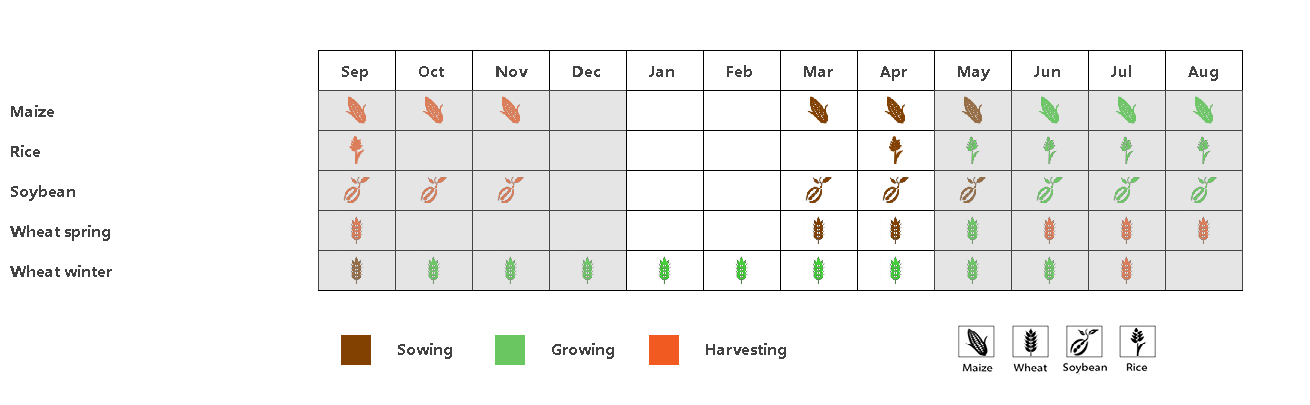
Figure 1 Phenology of maize, rice, soybean, spring and winter wheat in the United States
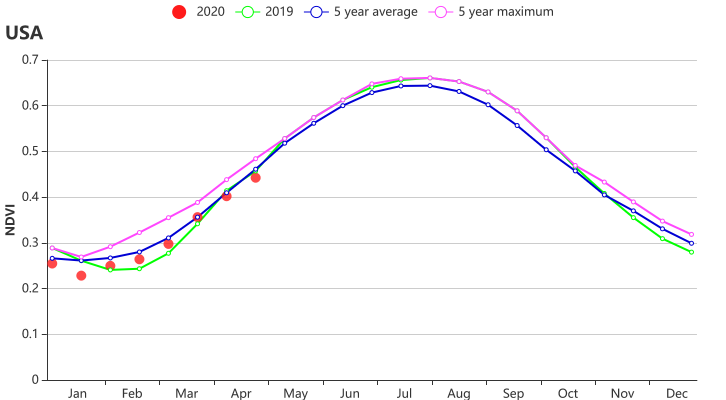
Figreu 2 Crop condition development graph based on NDVI
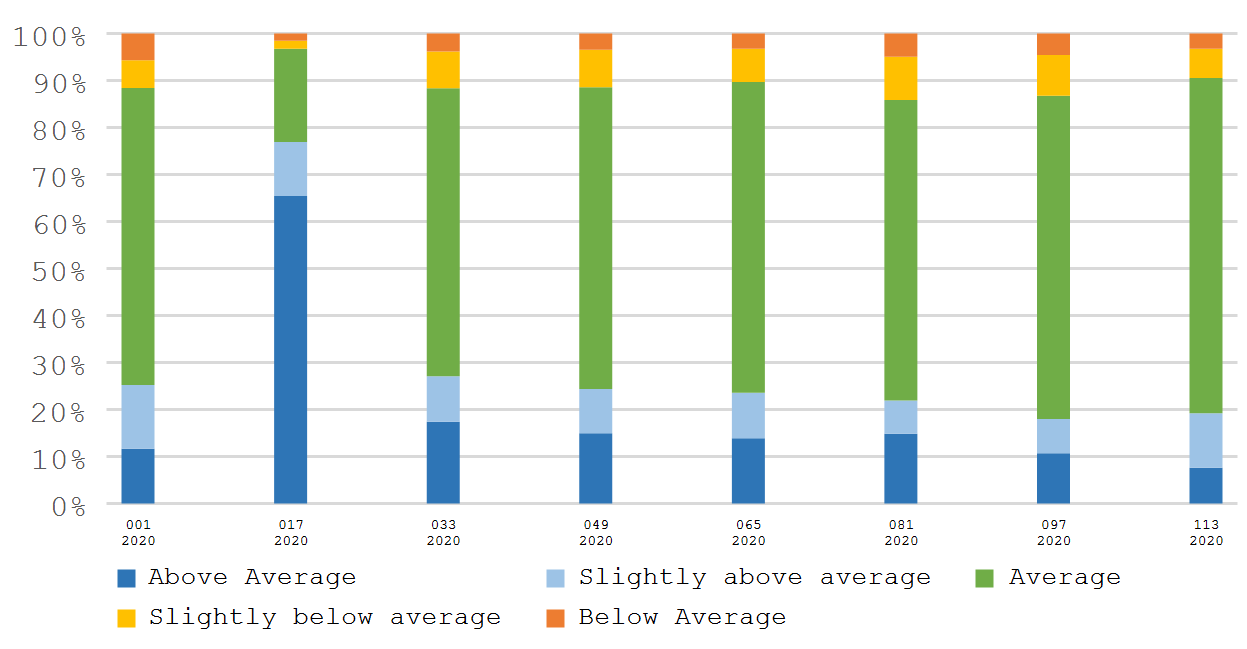
Figure 3 stasticial of crop growth condtion within monitoring period
Compared with the average of the same period in the past 15 years, precipitation (+17%) and air temperature (+0.7 ℃) were higher for the United States. But photosynthetic effective radiation was significantly lower (-7%).
The Southern Great Plains, including Kansas, Oklahoma, Texas, and eastern part of Colorado, are the most important wheat producing states in this country. Far above average precipitation occurred in Kansas (+30%), Oklahoma (+51%) and Texas (+40%), while the photosynthetically active radiation was between 5 to 11% below the 15YA. Colorado was the only state that suffered from reduced precipitation (-3%). As mentioned in the section on North America of Chapter 2, drought occurred in western Kansas and Colorado. A cold snap in April had a negative impact on winter wheat growth in some areas. All in all, favorable growth conditions indicated by NDVI departure distribution and spatial pattern of NDVI departure clusters were observed for Texas and Oklahoma, while below average crop growth conditions were prevalent in western Kansas and Colorado.
The Pacific Northwest, including Washington, Oregon and Idaho, is another important winter wheat producing area of the United States. During this monitoring period, slightly-above average precipitation was observed in Washington (+2%) and Idaho (+1%), however the NDVI departure and NDVI anomaly clustering indicated that crop growth in this area is still below average which could be attributed to the ongoing drought.
Serious water deficit occurred in California and the precipitation was significantly lower than the average (-43%). However, the crop growth conditions appear to be normal, which can be attributed to the advanced irrigation infrastructure in California.

Figure 4 Spatial distribution of NDVI departure clusters
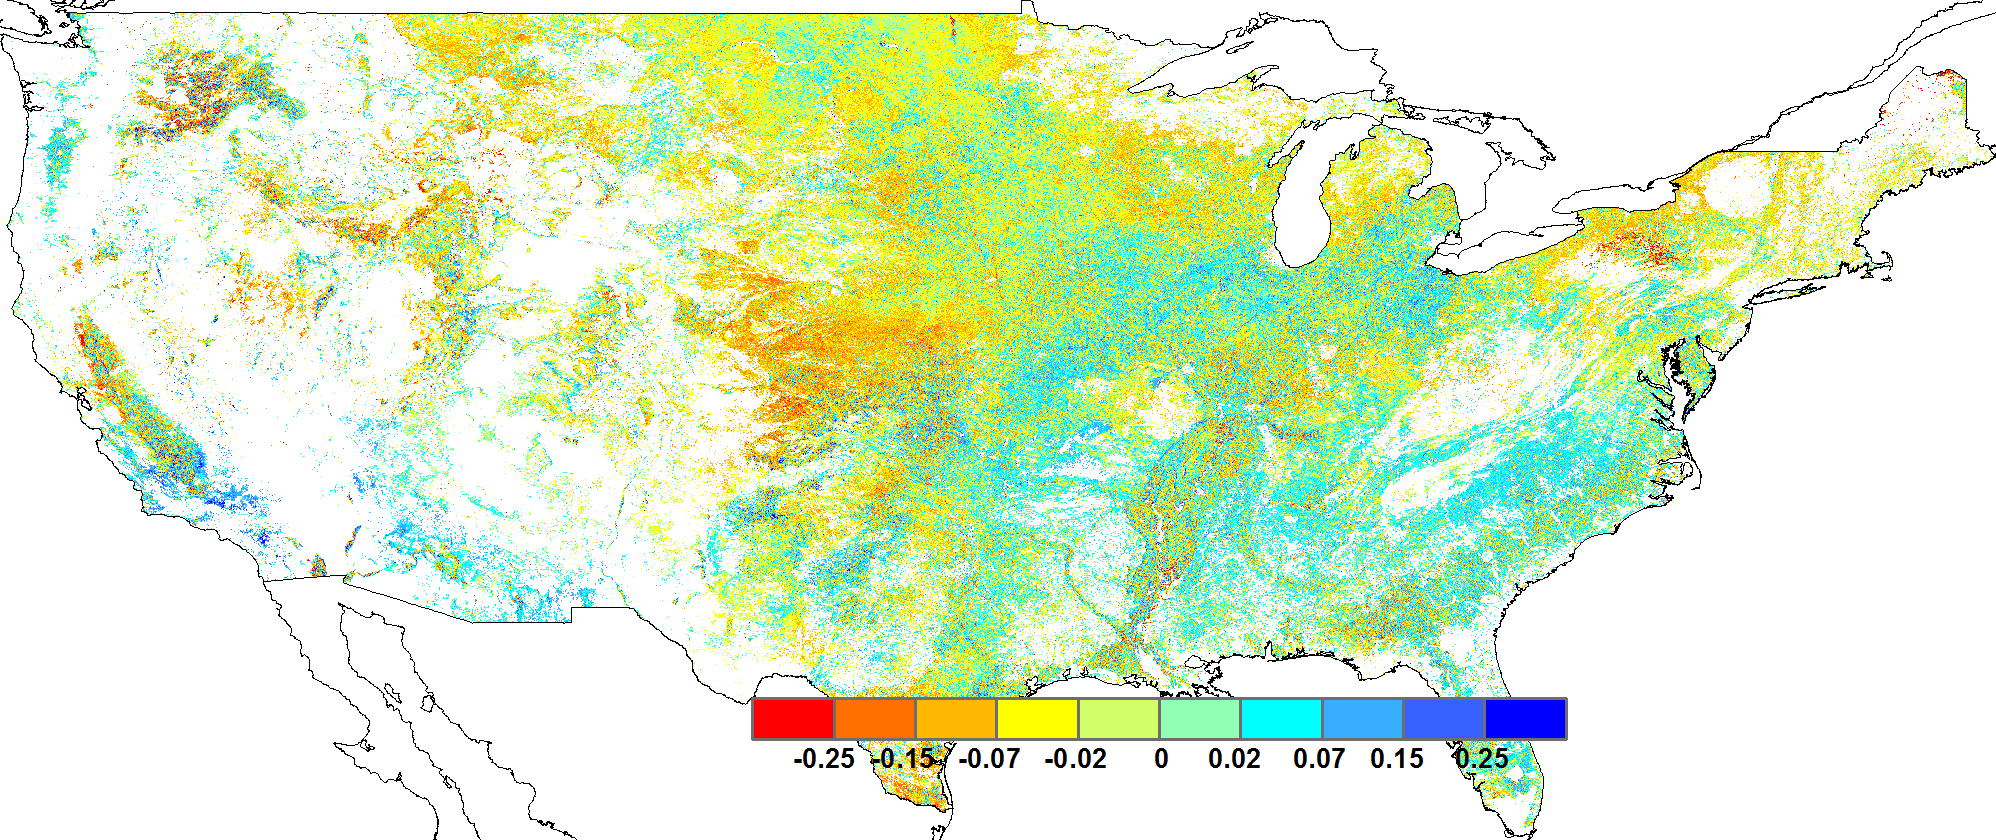
Figure 5 NDVI departure distribution
The spring wheat, soybean and rice planting period started in April. Some differences of the agro-climatic conditions were observed among the spring wheat and maize producing areas. Below-average precipitation occurred in the spring wheat production zones, such as Nebraska (-7%), North Dakota (-21%), and South Dakota (-11%) and Montana (-6%). The agro-climatic and crop growth conditions of spring wheat should be closely watched in next monitoring period. Above-average precipitation occurred in most states of the Corn Belt, including Illinois (+19%), Indiana (+6%), Michigan (+8%), Missouri (+28%), and Ohio (+11%), while in Iowa (-9%) and Minnesota (-5%) precipitation was below average. Conditions were favorable for the planting and growth of maize and soybeans. As the most important rice producing state, Arkansas received abundant precipitation during the monitoring period that replenished soil moisture for the sowing and growth of rice.
In short, the winter wheat growth conditions in Kansas and northwest regions were unfavorable while the other wheat producing regions experienced average or favorable conditions. Planting conditions for maize and soybean were favorable.
Regional analysis
The agro-climatic and crop growth conditions of the three major winter wheat producing areas and Corn Belt were as follows:
Southern Plains
The southern part of the Great Plains is the most important winter wheat producing area in the United States. During the monitoring period, winter wheat reached the heading or early grainfilling stages. Overall, Kansas, Oklahoma, and Texas received significantly above average precipitation, which is 30%, 51%, and 40% higher than the average, while precipitation in Colorado was below average by 3%. The abundant precipitation in Oklahoma and Texas effectively replenished the soil moisture and benefited winter wheat growth. Water stress and abnormal low temperatures occurred in April in Colorado and western Kansas that hindered winter wheat growth. In summary, conditions for winter wheat in Oklahoma and Texas were normal but unfavourable in western Kansas and Colorado. The conditions of the crops should be closely watched in next reporting period.
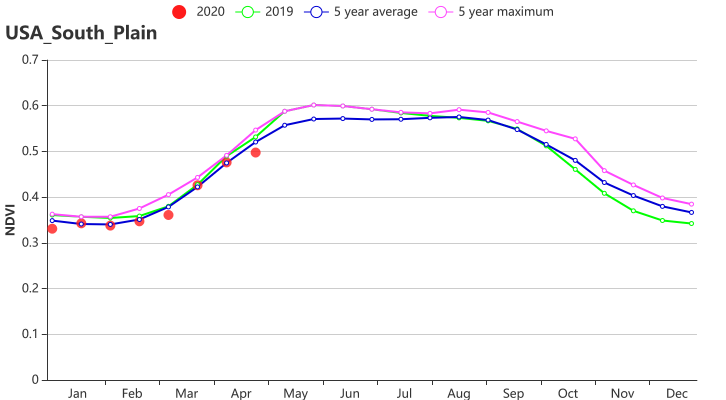
Figure 6 Crop condition development graph based on NDVI in South Plain
Northwest Pacific
The Pacific Northwest is an important winter wheat production area in the United States. The crop condition development graph based on NDVI shows that crop growth by the end of April was close to the 2019 conditions, but below the 5YA. In the last reporting period, this region suffered from a moderate precipitation deficit. Even though precipitation recovered to slightly below average (-3%) in the current period, a water deficit still persists.
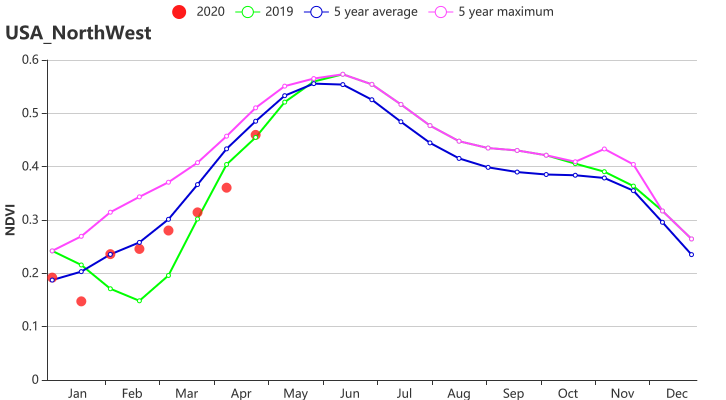
Figure7 Crop condition development graph based on NDVI
California
California experienced a serious precipitation deficit. As compared to the 15YA, precipitation (-43%) was below average and temperature above (+0.2℃). This monitoring period is the wet season of California. The drought led to a below average development of the NDVI curve, but due to wide-spread irrigation, crop conditions were slightly above the 5YA by the end of this monitoring period.
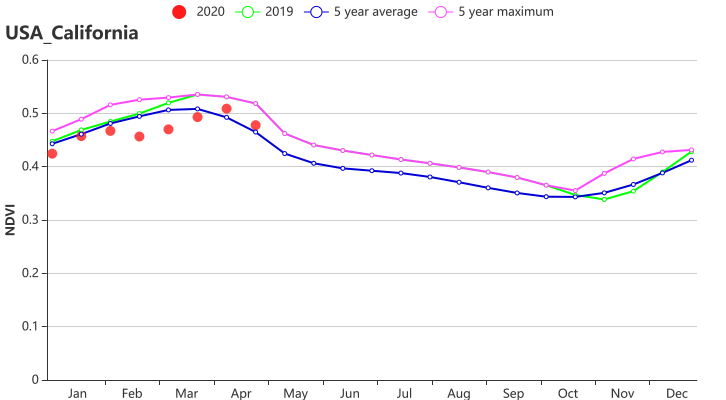
Figure.X Crop condition development graph based on NDVI
Corn Belt
This region is the most important soybean and maize producing area in the United States. In April, planting of maize and soybeans started. In general, precipitation was above average by 6%, and temperature was above average by 0.6℃. Above-average precipitation was observed in most states of the Corn Belt, including Illinois (+19%), Indiana (+6%), Michigan (+8%), Missouri (+28%) and Ohio (+11%). The conditions were favorable for sowing and early establishment of the crops.
Table 1: Agro-climatic indicators of major winter crops zones, current season's values and departure from 15YA, January to April 2020
| Region | RAIN | TEMP | RADPAR | BIOMSS | ||||
| Current (mm) | Departure from 15YA (%) | Current (°C) | Departure from 15YA (°C) | Current (MJ/m2) | Departure from 15YA (%) | Current (gDM/m2) | Departure from 15YA (%) | |
| Blue Grass region | 708 | 40 | 7.7 | 1.1 | 654 | -13 | 175 | -17 |
| California | 232 | -43 | 8.9 | 0.2 | 896 | 1 | 234 | 5 |
| Corn Belt | 350 | 6 | 1 | 0.6 | 637 | -7 | 119 | -10 |
| Lower Mississippi | 687 | 32 | 12.4 | 1.1 | 721 | -11 | 270 | -10 |
| North-eastern areas | 470 | 12 | 2.7 | 1.4 | 618 | -10 | 119 | -16 |
| Northwest | 431 | -3 | 1.5 | 0.3 | 670 | 2 | 129 | 2 |
| Northern Plains | 196 | -9 | -1.3 | -0.1 | 757 | 1 | 509 | -12 |
| Southeast | 573 | 35 | 13.8 | 1.7 | 816 | -8 | 329 | -2 |
| Southwest | 173 | 3 | 5.6 | 0.1 | 983 | -3 | 229 | 11 |
| Southern Plains | 381 | 37 | 10.4 | 0.5 | 804 | -9 | 268 | -3 |
Table 2 Agronomic indicators of major winter crops zones, current season's values and departure from 5YA, January to April 2020
| Region | Cropped arable land fraction | Maximum VCI | |
| Current (%) | Departure from 5YA (%) | Current | |
| Blue Grass region | 97 | 0 | 0.89 |
| California | 81 | 5 | 0.82 |
| Corn Belt | 36 | 0 | 0.82 |
| Lower Mississippi | 80 | 7 | 0.9 |
| North-eastern areas | 95 | 1 | 0.88 |
| Northwest | 50 | -17 | 0.76 |
| Northern Plains | 95 | 11 | 0.96 |
| Southeast | 100 | 0 | 0.95 |
| Southwest | 16 | -5 | 0.8 |
| Southern Plains | 64 | -1 | 0.78 |