 English
 中文
中文
Bulletin
wall bulletinMenu
- Overview
- Country analysis
- Afghanistan
- Angola
- Argentina
- Australia
- Bangladesh
- Belarus
- Brazil
- Canada
- Germany
- Egypt
- Ethiopia
- France
- United Kingdom
- Hungary
- Indonesia
- India
- Iran
- Italy
- Kazakhstan
- Kenya
- Cambodia
- Sri Lanka
- Morocco
- Mexico
- Myanmar
- Mongolia
- Mozambique
- Nigeria
- Pakistan
- Philippines
- Poland
- Romania
- Russia
- Thailand
- Turkey
- Ukraine
- United States
- Uzbekistan
- Viet Nam
- South Africa
- Zambia
- Kyrgyzstan
Authors: 超级管理员 | Edit: zhaoxf
In the Ukraine, maize, winter wheat and canola were the major crops in the field during this monitoring period. Maize was planted in May and winter wheat harvest began in July.
After drier-than-normal conditions in late winter, rainfall was abundant starting in May. In the course of this monitoring period, it reached 356 mm (+19%). Temperatures were colder than average (TEMP, 15 ℃, -1℃ ) with normal RADPAR (1225 MJ/m², -1%). Based on the agroclimatic conditions, CropWatch predicts that the potential biomass is 6% below the 5YA, mainly due to the dry conditions observed during April and the cold weather conditions in May, when temperatures were more than 6℃ below the 15YA. Almost all cropland was cultivated (CALF, 99%) and the maximum vegetation condition index (VCIx) reached 0.90, which was favorable.
At the national level, NDVI was below the 5-year-average until late June. NDVI on 23.6% of the cropland, concentrated in southern areas, especially in Odessa and Crimea experienced a significant depression before July, consistent with the low VCIx (mainly between 0.5 and 0.8 with some below 0.5 ), indicating crop conditions were not favorable in this area. This was due to drought conditions observed during the previous monitoring period from which winter wheat could not fully recover. Crop development in other areas was generally good and VCIx (above 0.8) indicates favorable prospects for the summer crops.
In summary, drought conditions during the early spring had a negative impact on winter wheat, which explains the below average development of NDVI from April to June. The maize crop was off to a better start and reached maximum levels in July. Hence, conditions were sub-optimal for wheat, but favorable for maize.
Regional analysis
Regional analyses are provided for four agro-ecological zones (AEZ) defined by their cropping systems, climatic zones and topographic conditions. They are referred to as Central wheat area with the Poltava, Cherkasy, Dnipropetrovsk and Kirovohrad Oblasts; Northern wheat area with Rivne; Eastern Carpathian hills with Lviv, Zakarpattia and Ivano-Frankivsk Oblasts and Southern wheat and maize area with Mykolaiv, Kherson and Zaporizhia Oblasts.
The Central wheat area had sufficient rainfall (324 mm, +20%) while temperature (-1.1℃) and radiation (-1%) were below the 15YA. The BIOMASS (525g DM/m²) is estimated to be 7% lower than the 5YA. The agronomic indicators show a very good CALF (100%) and VCIx (0.95). The NDVI development profile also confirmed unfavorable conditions until June, when they started to surpass the 5YA. Conditions for the summer crops are favorable.
The Northern wheat area received 370 mm of rainfall (+14%) and TEMP (14.1℃, -1.2℃) and RADPAR (1159 MJ/m², -2%) were lower than the 15YA. Because of cooler temperatures and less sunshine, the BIOMASS indicator reached 464g DM/m2, 9% below average. The CALF was 100% and maximum VCIx was 0.96. NDVI was above the 5YA starting in July, overall crop conditions were unfavorable until June and greatly improved in July.
The conditions in the Eastern Carpathian hills showed a similar pattern as the other regions: abundant rainfall (538 mm, +26%), cooler temperatures (13.2℃, -1.3℃) and low RADPAR (1182 MJ/m², -3%) resulted in decreased potential BIOMSS (422 g DM/m², -14%). High CALF (100%) and VCIx at 0.97, as well as NDVI, indicate favorable conditions for the summer crops.
The Southern wheat and maize area also received more rainfall (+24%) and experienced cooler temperatures (-1) and sightly higher radiation (+1%). CALF (99%) was high, but VCI (0.85) was fair. Accordingly, NDVI stayed below the 5YA throughout this monitoring period. Crop conditions were below average.
Figure 3.41 Ukraine's crop condition, April - July 2020
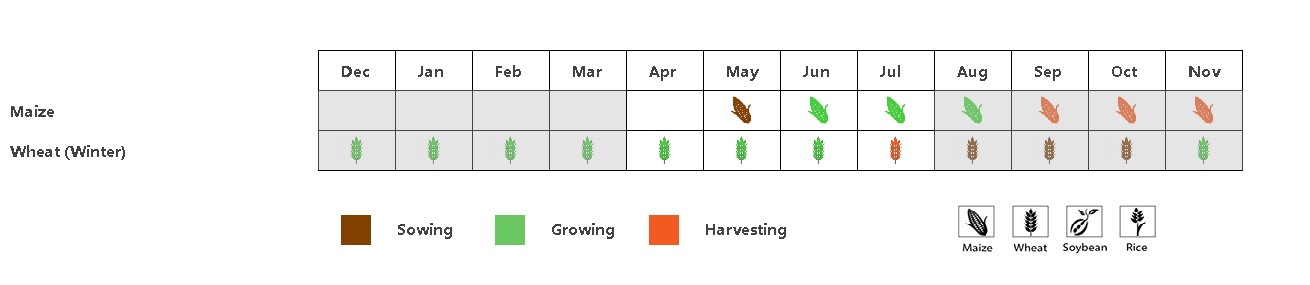
(a) Phenology of major crops
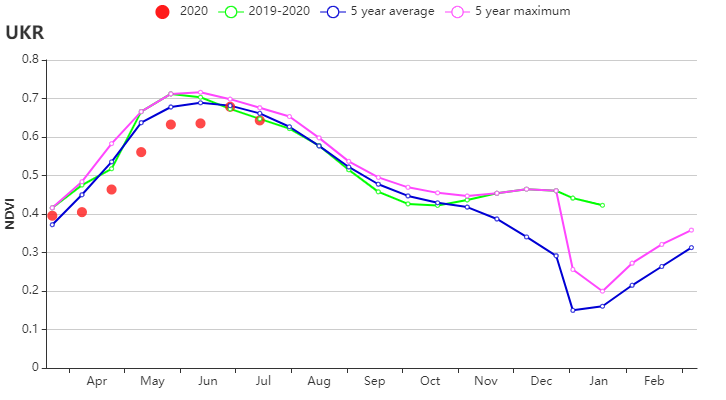
(b) Crop condition development graph based on NDVI
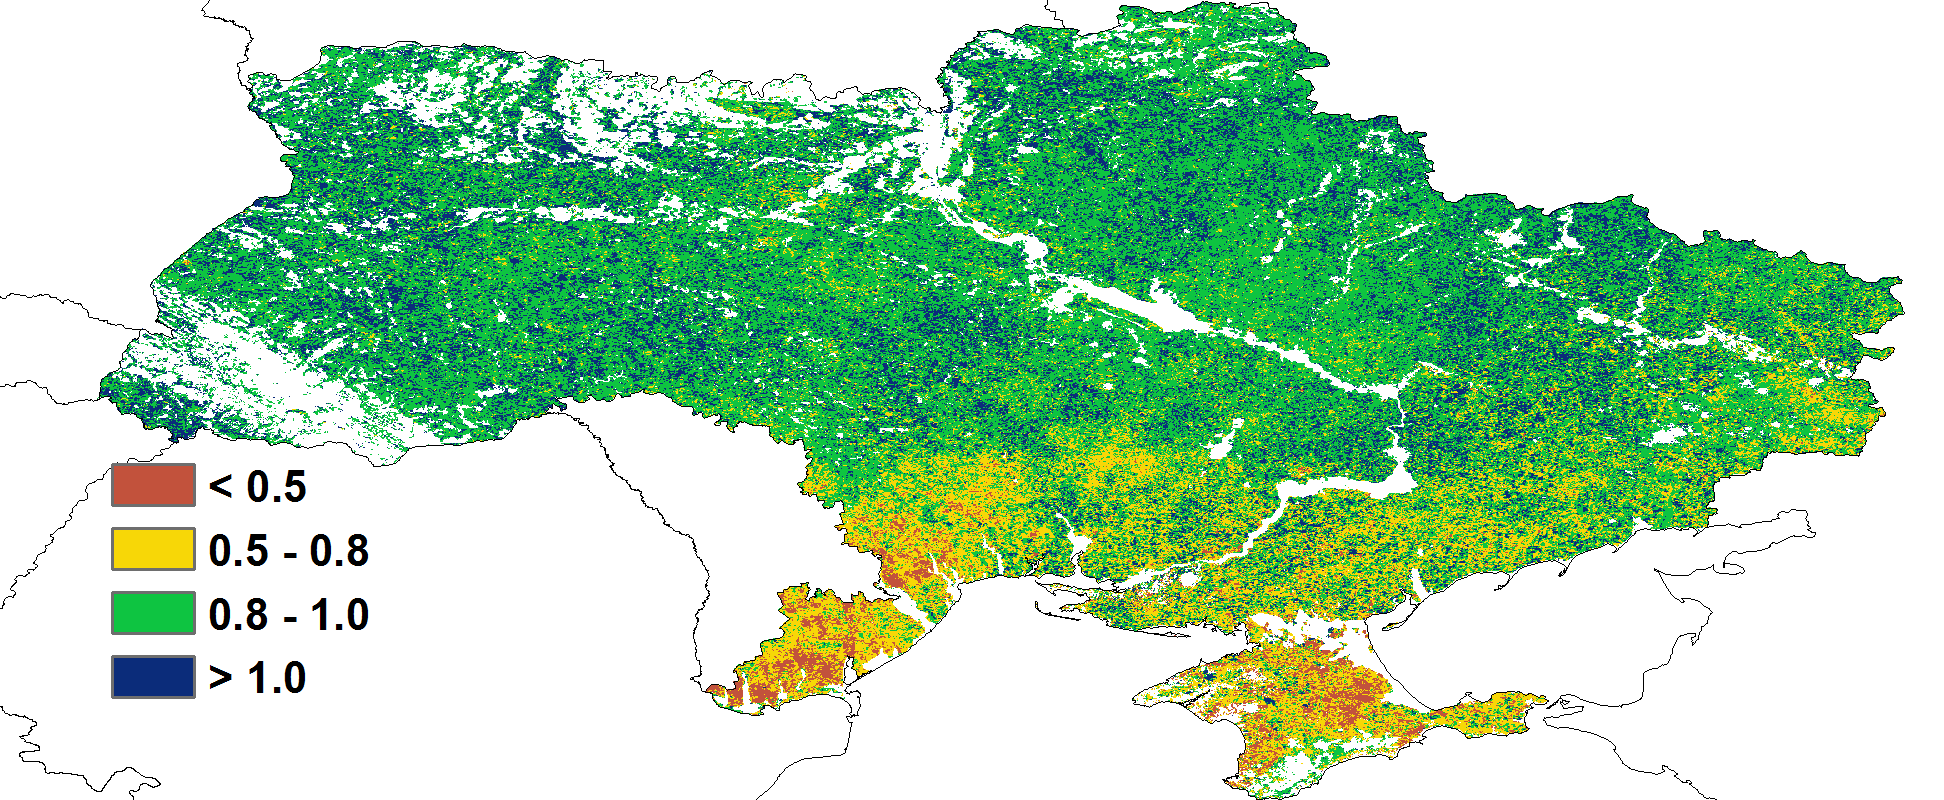
(c) Maximum VCI

(d) Spatial NDVI patterns compared to 5YA (e) NDVI profiles
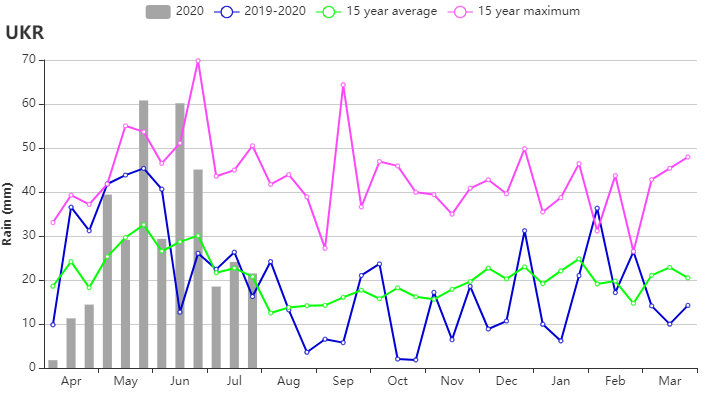
(f) Rainfall profile

(g) Temperature profile

(h) Crop condition development graph based on NDVI (Central wheat area)
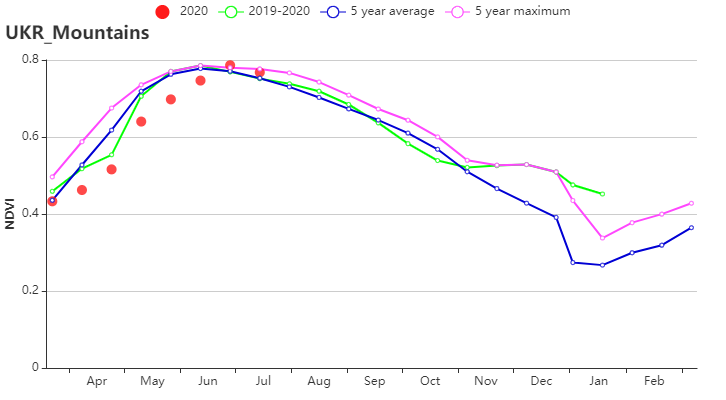
(i) Crop condition development graph based on NDVI (Eastern Carpathian hills) 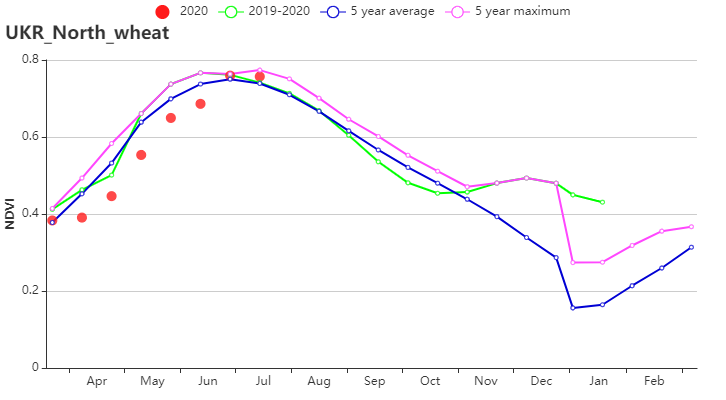
(j) Crop condition development graph based on NDVI (Northern wheat area)

(k) Crop condition development graph based on NDVI (Southern wheat and maize area)
Table 3.73 Ukraine agro-climatic indicators by sub‐national regions, current season's values and departure from 15YA, April - July 2020
RAIN | TEMP | RADPAR | BIOMSS | |||||
Region | Current (mm) | Departure from 15YA (%) | Current (°C) | Departure from 15YA (°C) | Current (MJ/m2) | Departure from 15YA (%) | Current (gDM/m2) | Departure from 15YA (%) |
Central wheat area | 344 | 20 | 15.1 | -1.1 | 1231 | -1 | 525 | -7 |
Eastern Carpathian hills | 538 | 26 | 13.2 | -1.3 | 1182 | -3 | 422 | -14 |
Northern wheat area | 370 | 15 | 14.1 | -1.2 | 1159 | -2 | 464 | -9 |
Southern wheat and maize area | 302 | 25 | 16.5 | -1.0 | 1294 | 1 | 596 | -3 |
Table 3.74 Ukraine agronomic indicators by sub‐national regions, current season's valuesand departure from 15YA, April - July 2020
CALF | Maximum VCI | ||
Region | Current (%) | Departure from 5YA (%) | Current |
Central wheat area | 100 | 0 | 0.95 |
Eastern Carpathian hills | 100 | 0 | 0.97 |
Northern wheat area | 100 | 0 | 0.96 |
Southern wheat and maize area | 99 | 0 | 0.85 |