 English
 中文
中文
Bulletin
wall bulletinMenu
- Overview
- Country analysis
- Afghanistan
- Angola
- Argentina
- Australia
- Bangladesh
- Belarus
- Brazil
- Canada
- Germany
- Egypt
- Ethiopia
- France
- United Kingdom
- Hungary
- Indonesia
- India
- Iran
- Italy
- Kazakhstan
- Kenya
- Cambodia
- Sri Lanka
- Morocco
- Mexico
- Myanmar
- Mongolia
- Mozambique
- Nigeria
- Pakistan
- Philippines
- Poland
- Romania
- Russia
- Thailand
- Turkey
- Ukraine
- United States
- Uzbekistan
- Viet Nam
- South Africa
- Zambia
- Kyrgyzstan
Authors: 超级管理员 | Edit: zhaoxf
This reporting period covers the end of the harvest period for the rainfed crops and the onset of the irrigated season mainly for winter wheat and horticultural crops. The harvest of the 2020 cereal crops started in April and concluded in July. A delay in the start of the seasonal rains had affected crop establishment, however precipitation stabilized and was generally conducive to normal crop growth.
During this period the average rainfall received was 43 mm with the highest in the Northern High Rainfall zone (86 mm, 15Yr Dep. -16%) and lowest in Western Semi arid zone (10 mm, 15Yr Dep. -74%). Generally, the CALF was above 98% in all the zones and VCIx above 0.82. BIOMSS production varied from 155 to 380 gDM/m2 during this reporting period, which was below average due to low rainfall. Drier-than-normal conditions also negatively affected NDVI, which was below the 5-year average, but slightly better than average conditions.
Variable spatial-temporal patterns of rainfall in some parts of the Southern and Western provinces caused localized floods and drought, which in turn negatively impacted crop production. Cereal production was estimated slightly above average at 3.220 million metric tonnes. The COVID-19 pandemic may trigger an increase in the prevalence of malnutrition as a result of a reduction in economic activities and associated income losses, and a knock-on effect on local market supplies.
Regional analysis
Luangwa and Zambezi Valleys and the Western Semi-Arid Plain received less than 15 mm rainfall representing more than a 65% decrease from the 15-year average. In the Northern High Rainfall Zone, conditions were better. It received 86 mm, which was a 16% decrease from the 15Yr average. The Cropped Arable Land Fraction (CALF) was above 98% in all the AEZs. It was highest in the Northern high rainfall zone, where the Maximum Vegetation Condition Index (VCIx) reached 0.93, while Luangwa and Zambezi Valleys had the lowest VCIx (0.82). Based on a country-wide analysis, the southern, central, Lusaka and eastern provinces had a relatively lower VCIx than the other regions of the country.
The CropWatch indicators show better conditions than in 2019, however, some shortfalls are expected in the southern and western areas of Zambia. About 15% of the area planted with maize in the southern and central provinces were also affected by Fall Armyworm (FAW), which, together with the COVID-19, may cause hunger and malnutrition for the poor.
Table 3.83 Zambia’s agroclimatic indicators by sub-national regions, current season’s values and departure from 15YA, April - July 2020
RAIN | TEMP | RADPAR | BIOMSS
| |||||
Region | Current (mm) | Departure from 15YA (%) | Current (°C) | Departure from 15YA (°C) | Current (MJ/m2) | Departure from 15YA (%) | Current (gDM/m2) | Departure from 15YA (%) |
| Luangwa-Zambezi Rift Valley | 14 | -66 | 18.1 | -0.1 | 1096 | -2 | 264 | -20 |
| Western Semi-arid zones | 10 | -74 | 18.5 | -0.2 | 1180 | 0 | 155 | -25 |
| Central-Eastern Plateau | 21 | -65 | 18.1 | +0.1 | 1075 | -2 | 362 | -9 |
Northen High Rainfall Zone | 86 | -16 | 18.1 | -0.0 | 1153 | -2 | 380 | -2 |
Table 3.84 Zambia’s agronomic indicators by sub-national regions, current season’s values and departure from 5YA, April - July 2020
CALF | Maximum VCI | ||
Region | Current(%) | Departure from 5YA (%) | Current |
| Luangwa-Zambezi Valley | 98 | 2 | 0.82 |
| Western Semi-arid Zone | 100 | 1 | 0.93 |
Central-Eastern Plateau | 99 | 1 | 0.86 |
| Northen High Rainfall Zone | 100 | 0 | 0.93 |
Figure 3.46 Zambia’s crop condition, April - July 2020

Figure A: Crop Phenology Map of Zambia
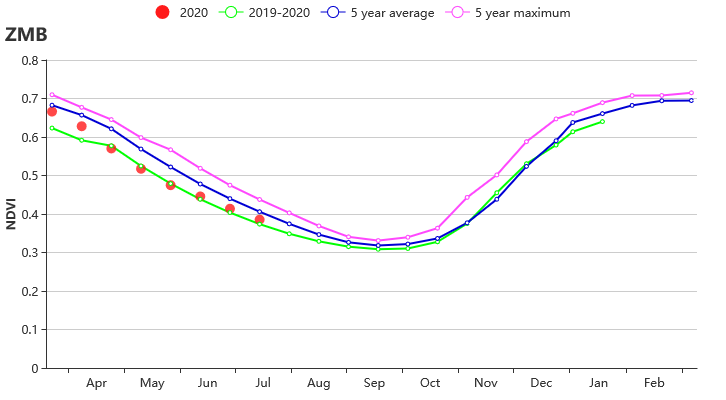
Figure B: Crop condition development graph based on NDVI

Figure C: Time series rainfall pofile

Figure D: Time series temperature pofile

Figure E: Maximum VCI
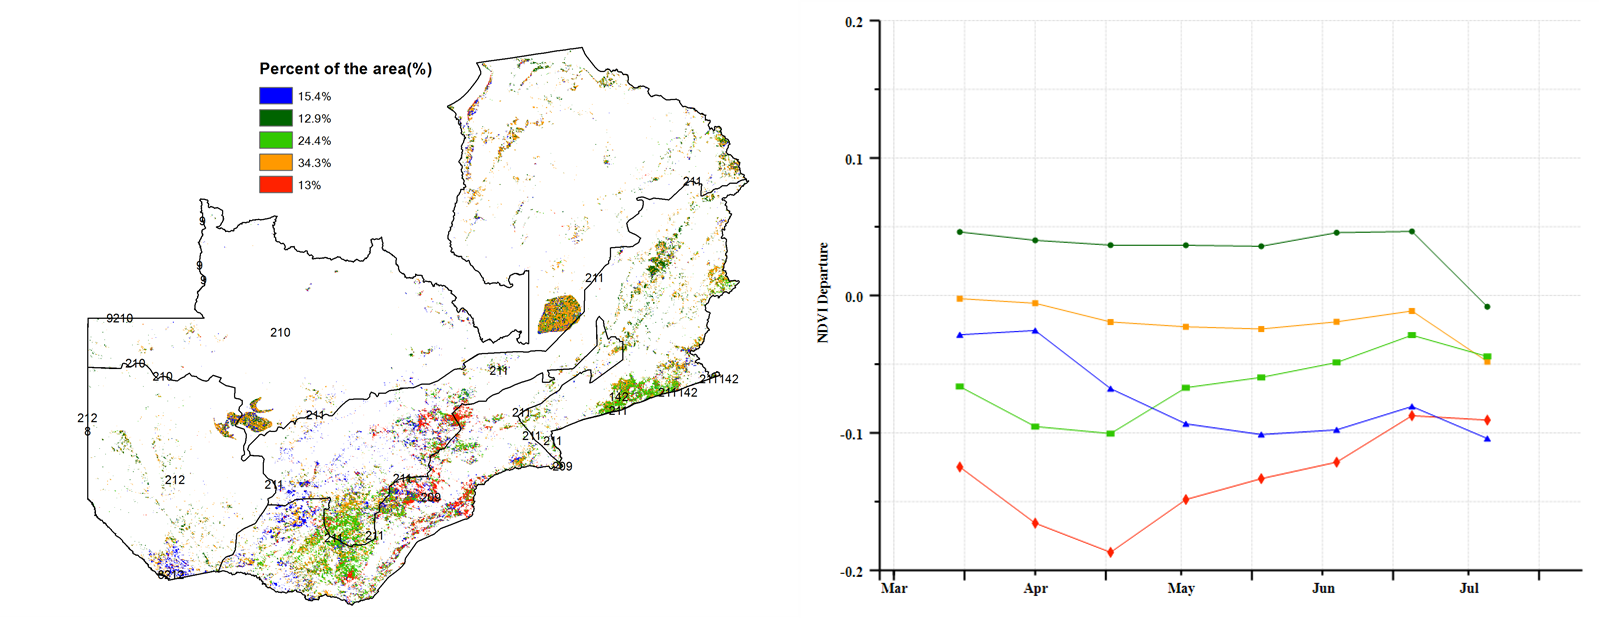
Figure F: Spatial distribution of NDVI profiles