 English
 中文
中文
Bulletin
wall bulletinMenu
- Overview
- Country analysis
- Afghanistan
- Angola
- Argentina
- Australia
- Bangladesh
- Belarus
- Brazil
- Canada
- Germany
- Egypt
- Ethiopia
- France
- United Kingdom
- Hungary
- Indonesia
- India
- Iran
- Italy
- Kazakhstan
- Kenya
- Cambodia
- Sri Lanka
- Morocco
- Mexico
- Myanmar
- Mongolia
- Mozambique
- Nigeria
- Pakistan
- Philippines
- Poland
- Romania
- Russia
- Thailand
- Turkey
- Ukraine
- United States
- Uzbekistan
- Viet Nam
- South Africa
- Zambia
- Kyrgyzstan
Authors: 超级管理员 | Edit: zhaoxf
The main crops grown in this region are winter wheat and maize. Winter wheat was sown in early October. Spring green up started in early March and the crop reached maturity in late May. Summer maize was sown right after winter harvest in early June. The NDVI curve for this region clearly depicts the distinctive growth periods for the two crops. It reaches the first peak in mid-April, which coincides with the heading of winter wheat and subsequently drops until late May, when wheat reaches maturity. The second peak can be attributed to maize and other summer crops grown in this region after wheat harvest. As shown in the previous CropWatch bulletin, wheat had an early start in this year. Its NDVI values were near the 5 year maximum until early April, when it started to drop below average. It remained below the 5YA until its harvest. The negative departure is not very large, but still indicates that conditions for winter wheat were slightly below average.
Maize on the other hand was off to a promising start. It reached maximum NDVI values in July.
The CropWatch weather parameters indicate that radiation was 5% below the 15YA. Temperatures were also cooler (-0.5 ºC), whereas precipitation was 10% above the 15YA. Potential biomass decreased by 9% as compared to the long-term average.
The map depicting the spatial distribution of NDVI development patterns indicates that the crop conditions were predominantly above average in the main wheat producing regions of Henan, Hebei, Anhui and Shandong. About 31.8% of cropland displays average NDVI conditions almost throughout the monitoring period.The spatial distribution of crop conditions follows patterns that are similar to those of the NDVI profiles. The regional average VCIx was 0.92 at the end of July. The map of potential biomass shows a decline in northern Henan and southern Hebei and a slight decline in southeastern Shandong.
Figure 4.13 Crop condition China Huanghuaihai region, April - July 2020

(a) Crop condition development graph based on NDVI
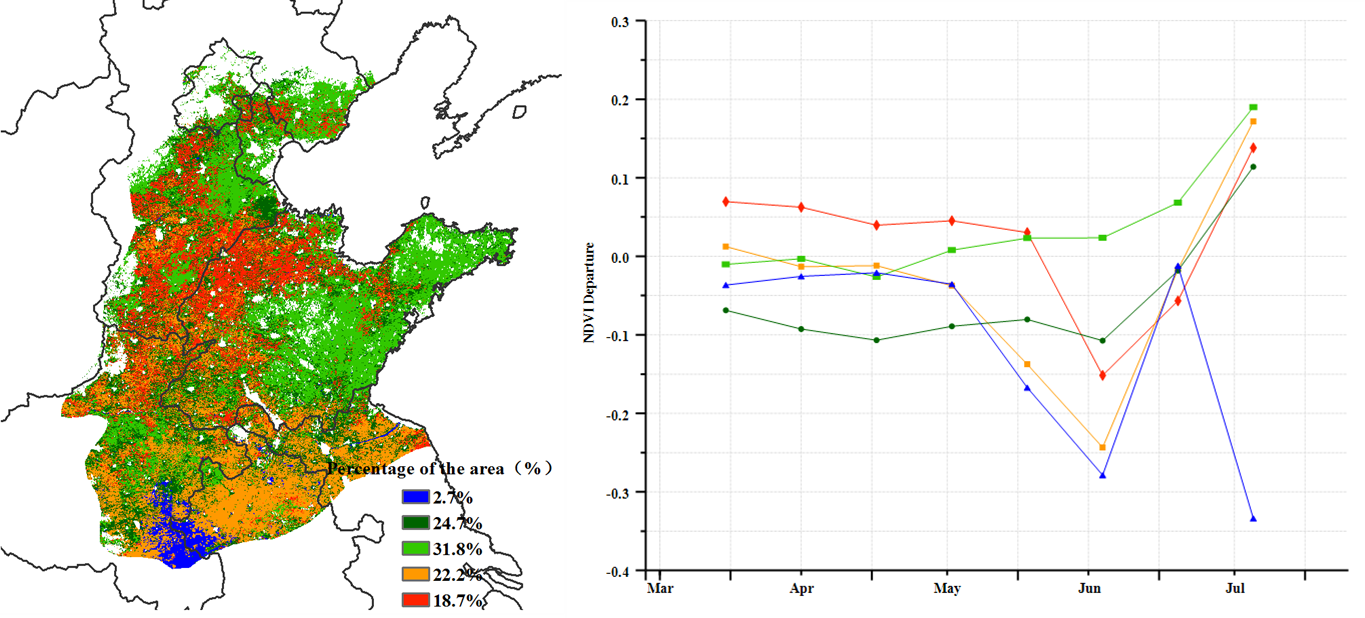
(b) Spatial distribution of NDVI profiles
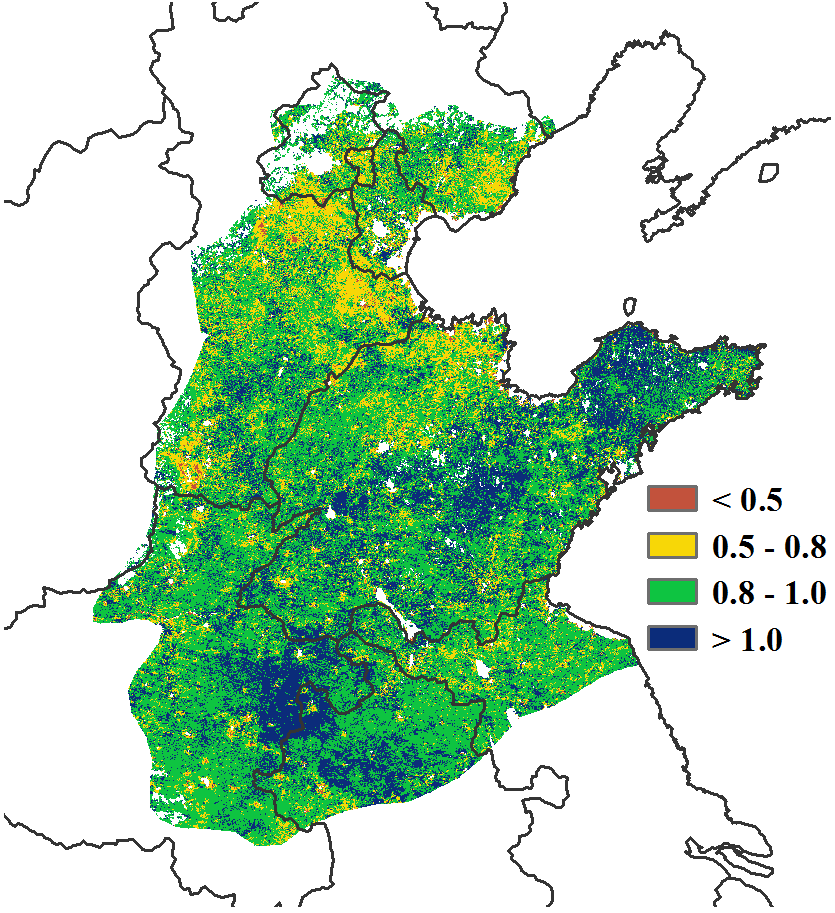
(c) Maximum VCI

(d) Potential biomass departure from 5YA