
Bulletin
wall bulletinMenu
- Overview
- Country analysis
- Afghanistan
- Angola
- Argentina
- Australia
- Bangladesh
- Belarus
- Brazil
- Canada
- Germany
- Egypt
- Ethiopia
- France
- United Kingdom
- Hungary
- Indonesia
- India
- Iran
- Italy
- Kazakhstan
- Kenya
- Cambodia
- Sri Lanka
- Morocco
- Mexico
- Myanmar
- Mongolia
- Mozambique
- Nigeria
- Pakistan
- Philippines
- Poland
- Romania
- Russia
- Thailand
- Turkey
- Ukraine
- United States
- Uzbekistan
- Viet Nam
- South Africa
- Zambia
- Kyrgyzstan
Authors: 超级管理员 | Edit: zhuliang
This monitoring period from July to October 2020 covers the main growing and harvesting seasons of soybean, maize, rice, and spring wheat. Sowing of winter wheat started in September. In general, the crop conditions were favorable.
During the monitoring period, the overall agro-climatic conditions in North American production areas were close to the 15-year average. Compared with the 15-year average, rainfall, temperature, and radiation were 3%, 0.4°C, and 1% below average, respectively. The rainfall in most areas varied greatly during the monitoring period. The rainfall in July was close to or above the average, but the rainfall fell below the average level from August to September except for Lower Mississippi region in late August, and late September to early October as well as the Southern Plain areas in early September, when hurricanes and tropical depressions brought abundant rainfall to those areas. The temperature anomaly graph shows that the temperatures in the northern plains and Canadian prairie in August and mid-September were 1-2°C higher than the average.
July and August are the crucial growth periods for the summer crops, and lack of rainfall can cause yield losses. Most areas experienced above-average rainfall until July and subsequently, rainfall trended slightly below average. Hence, only western Texas and Colorado were affected by droughts, apart from California (not shown). The minimum vegetation health index indicates that severe drought occurred during the monitoring period in the western part, and the maximum vegetation index also indicates the unfavorable crop condition in the region. According to the histogram of drought classification statistics, the proportion of drought in the main producing areas was gradually increasing from 10% at the begining of July to 25% at the end of October. Compared with the 15-year average, the potential biomass is 1% lower than the average, and the cropped arable land fraction also decreased by 1%. In short, moisture supply was adequate in most major crop production regions of the USA. Slightly drier weather in September and October helped provide favorable conditions for harvest. Overall, crop conditions were favorable.
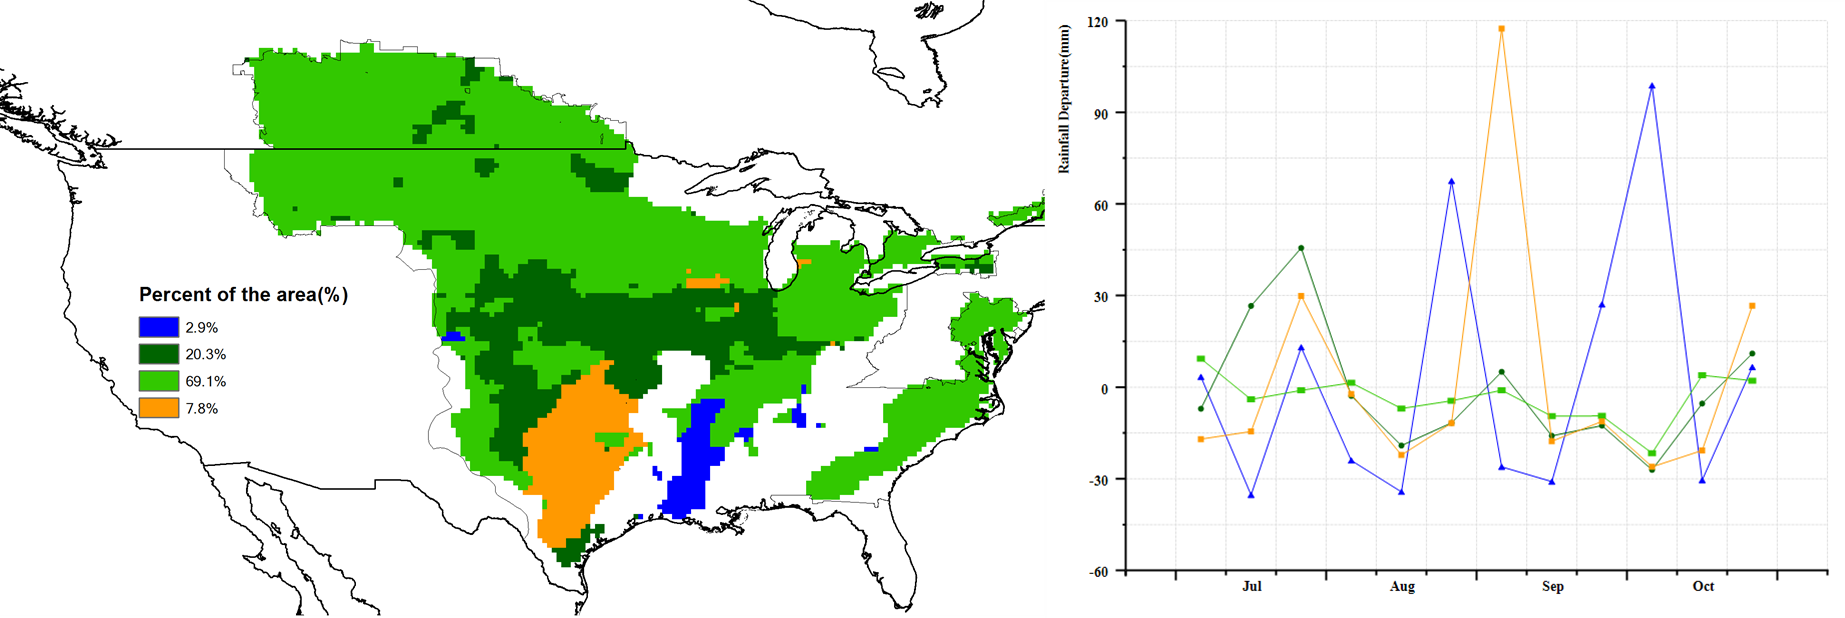
Spatial distribution of rainfall profiles

Spatial distribution of temperature profiles
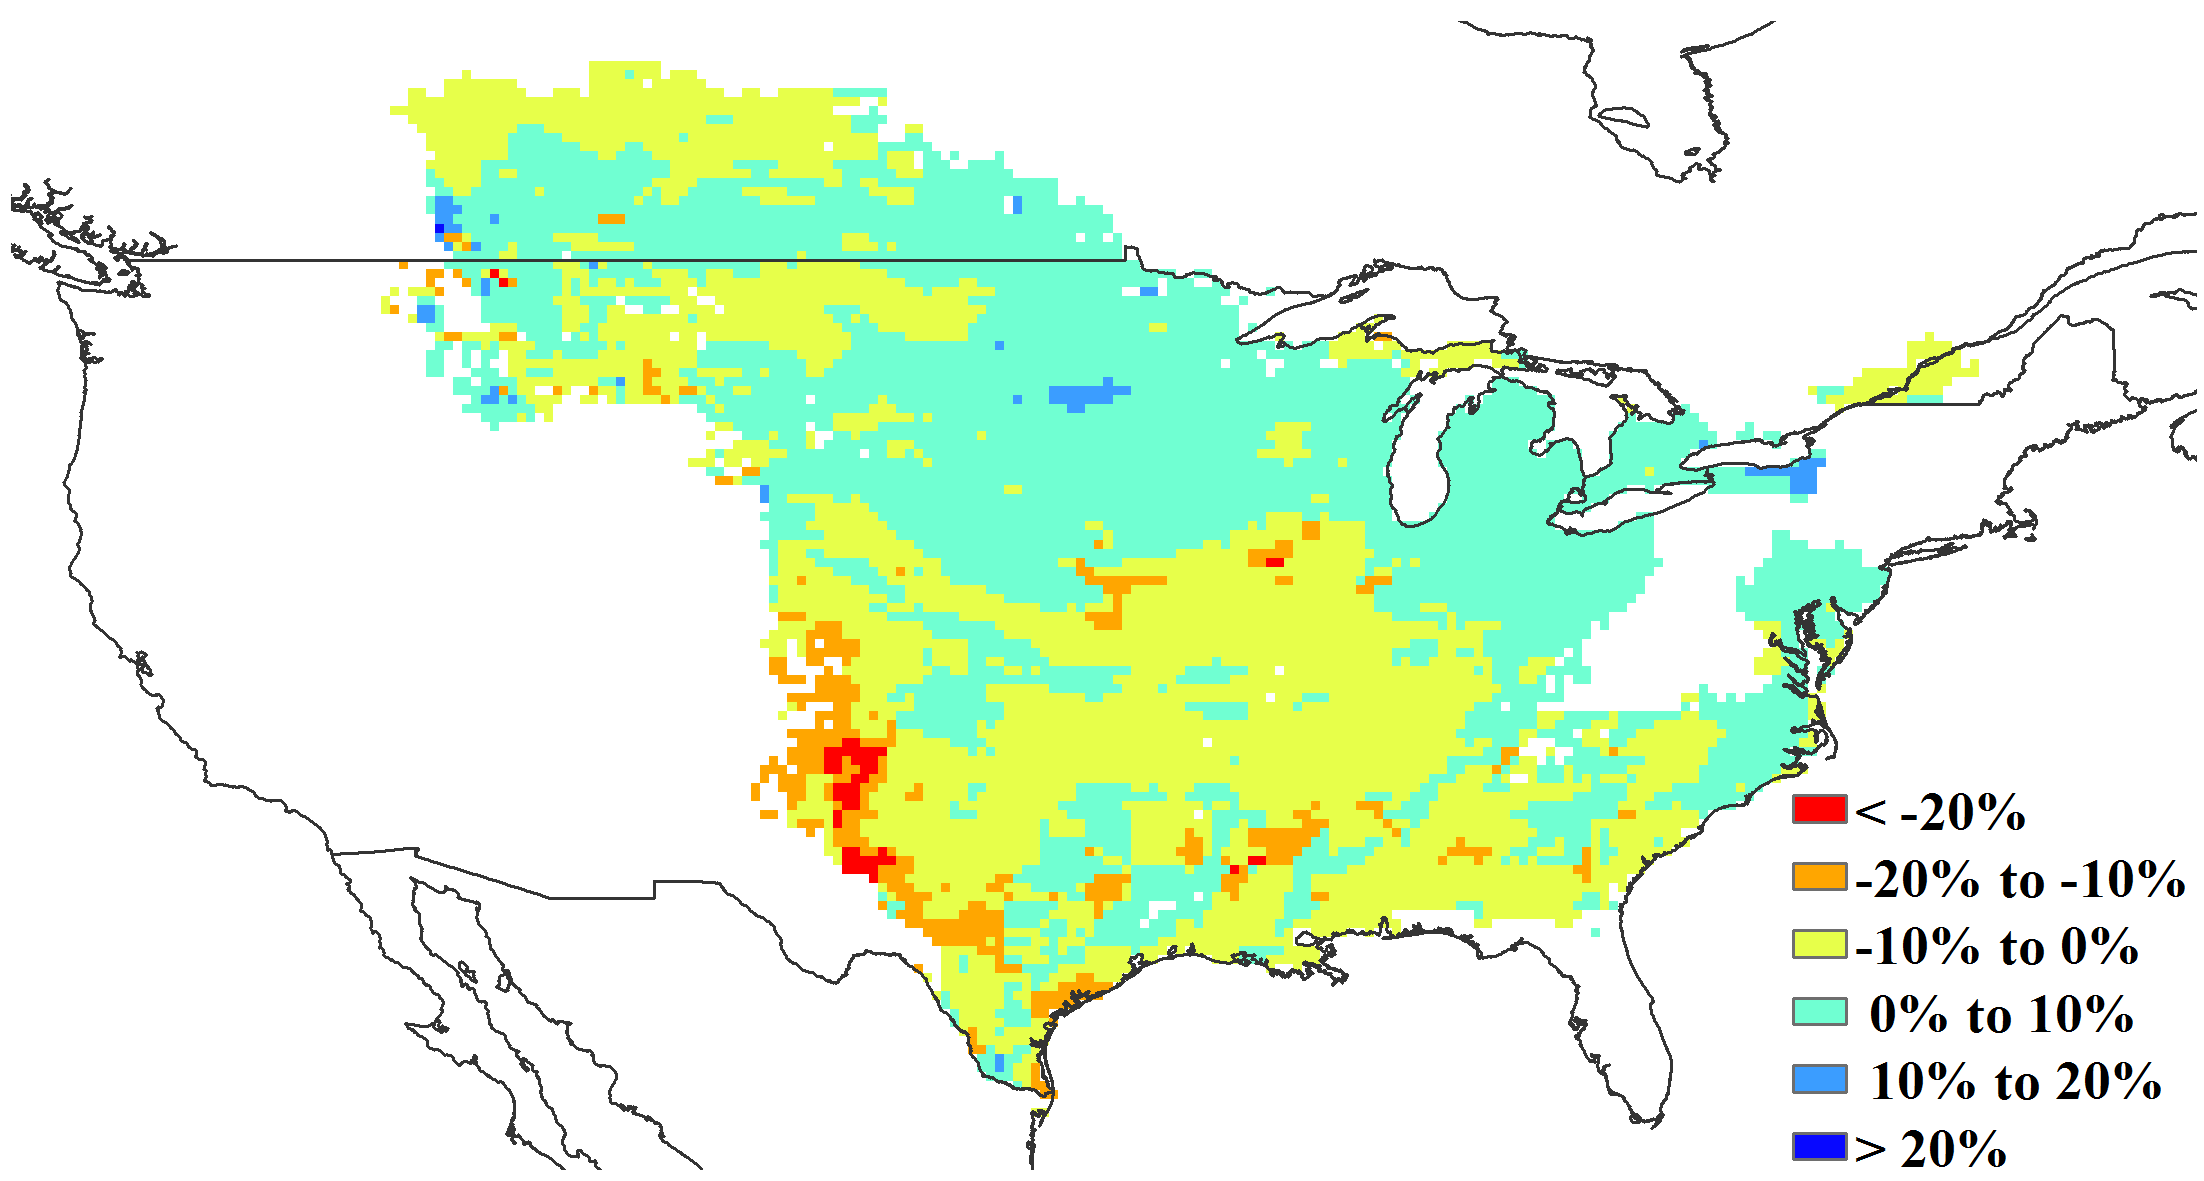
Potential biomass departure from 5YA
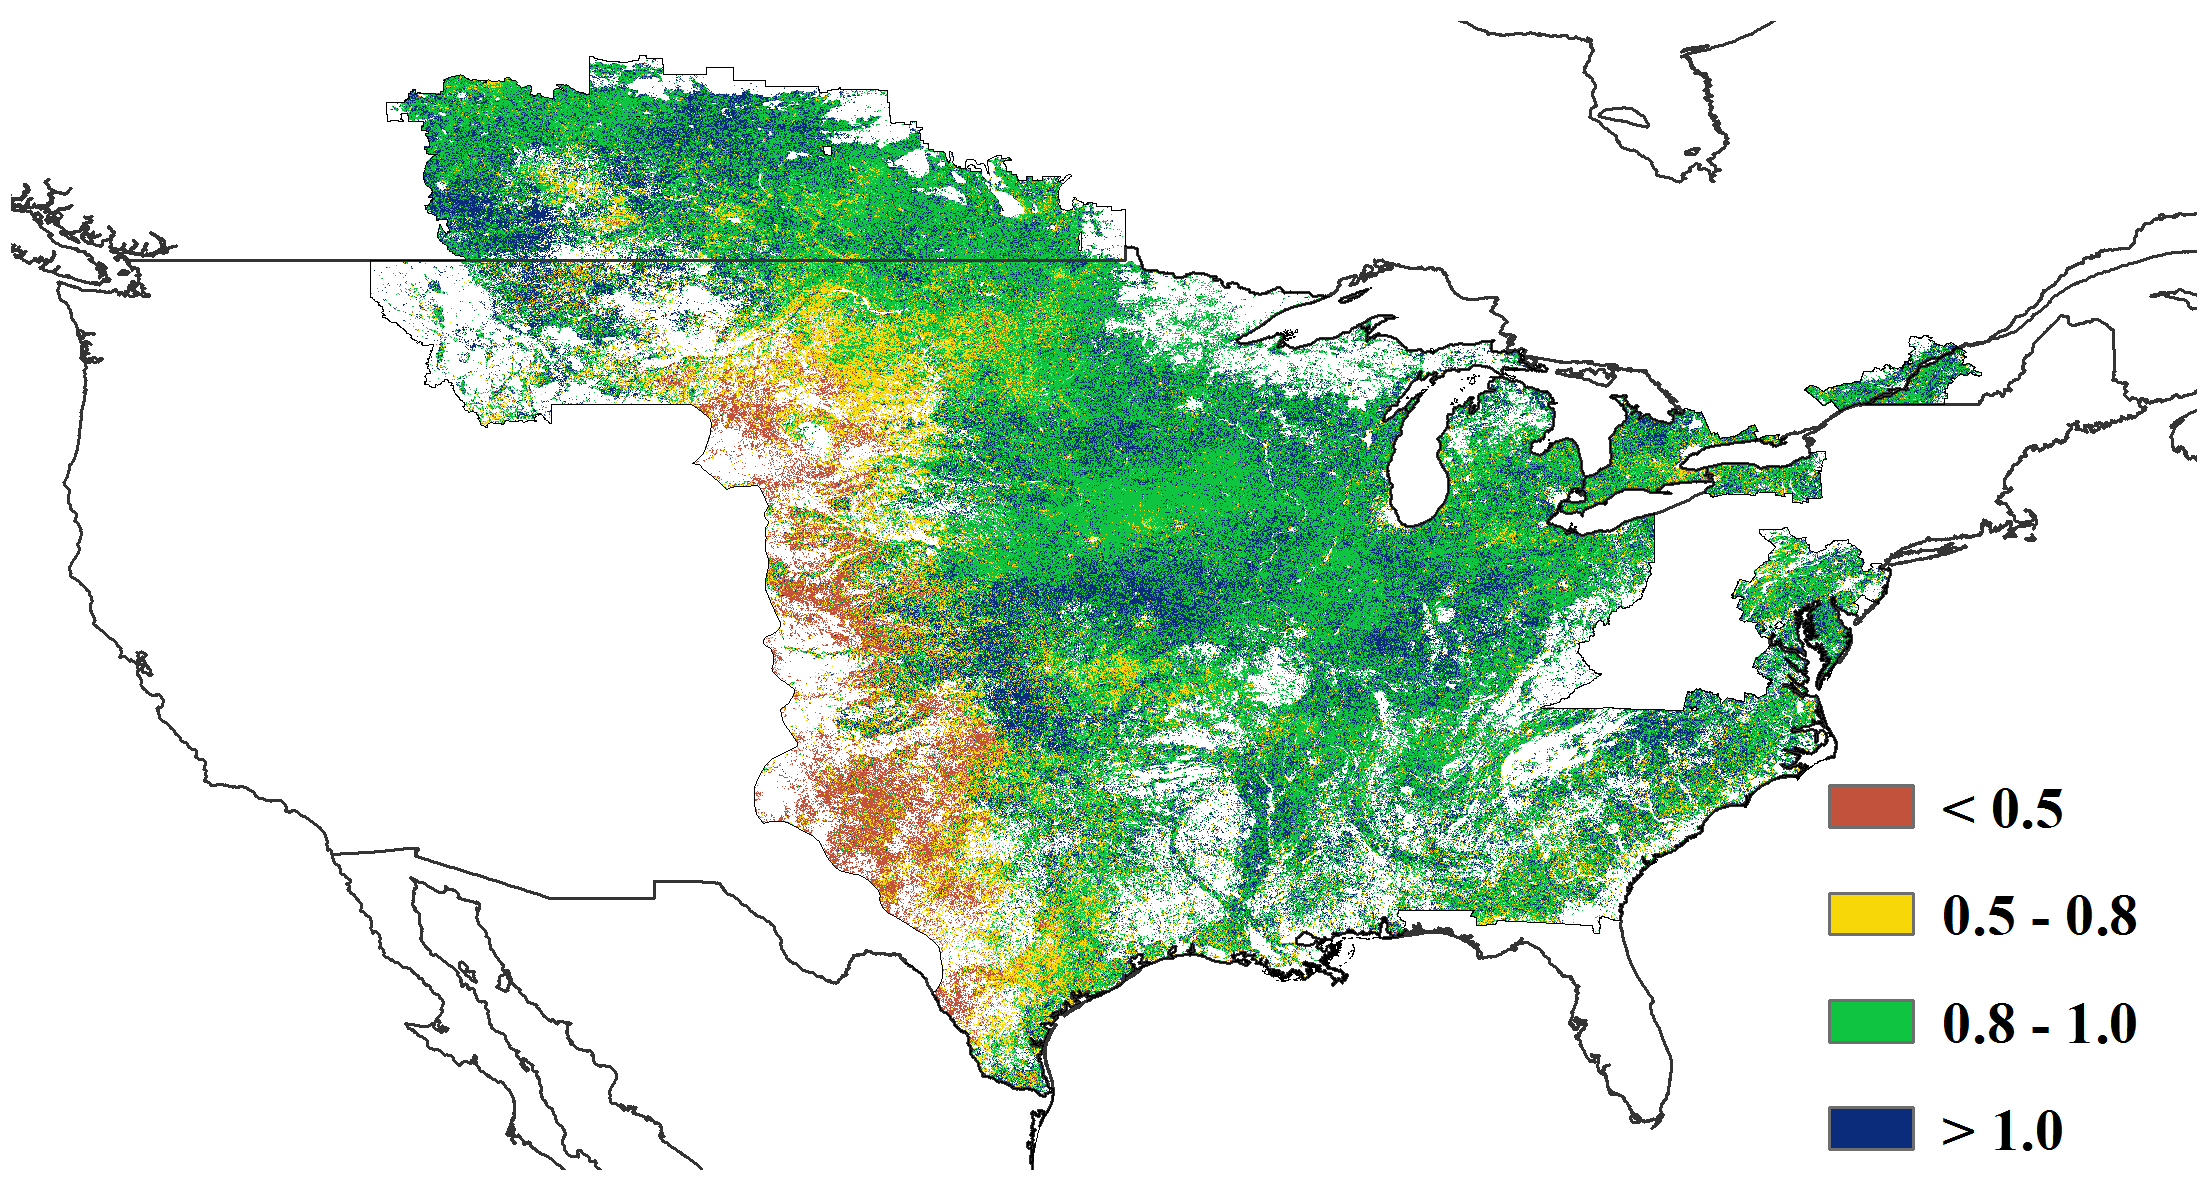
Maximum VCI
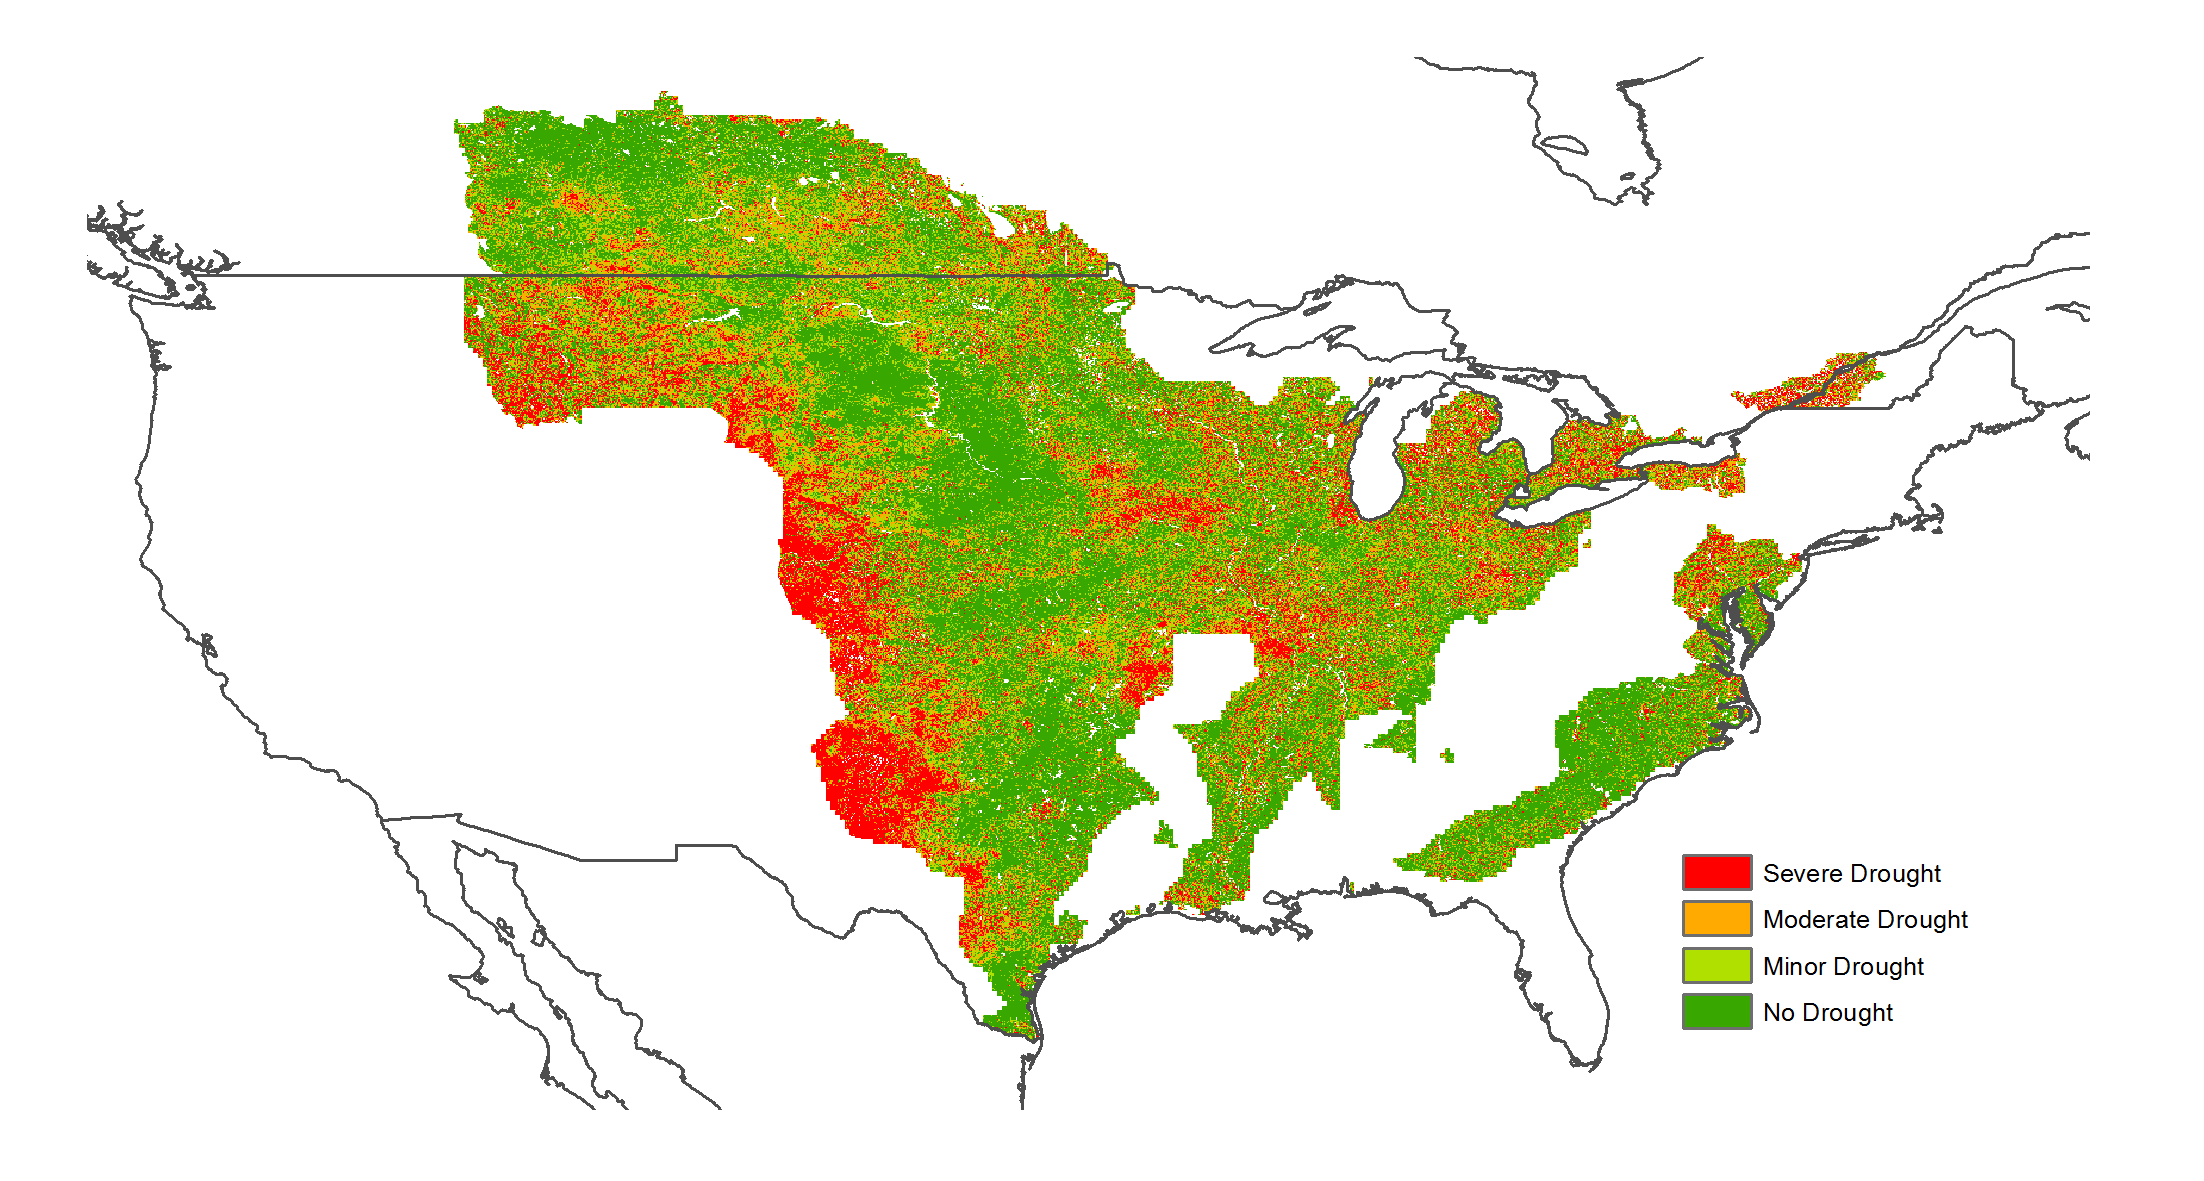
VHI Minimum

Cropped and uncropped arable land
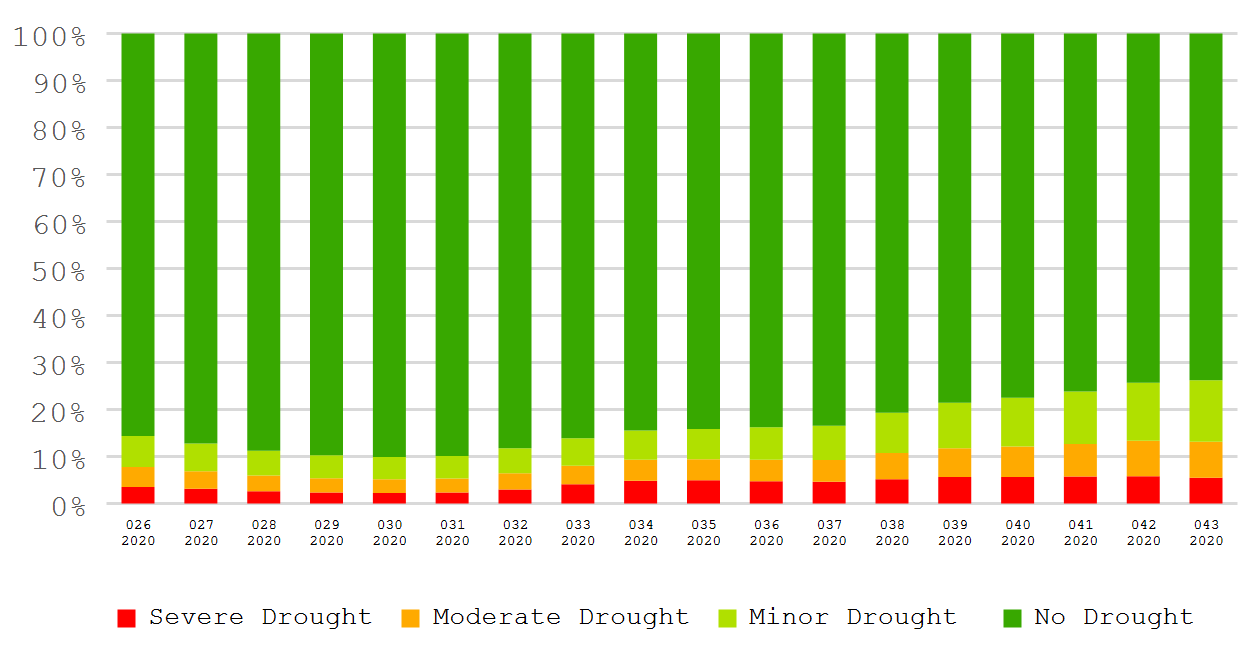
Proportions of different drought categories
