
Bulletin
wall bulletinMenu
- Overview
- Country analysis
- Afghanistan
- Angola
- Argentina
- Australia
- Bangladesh
- Belarus
- Brazil
- Canada
- Germany
- Egypt
- Ethiopia
- France
- United Kingdom
- Hungary
- Indonesia
- India
- Iran
- Italy
- Kazakhstan
- Kenya
- Cambodia
- Sri Lanka
- Morocco
- Mexico
- Myanmar
- Mongolia
- Mozambique
- Nigeria
- Pakistan
- Philippines
- Poland
- Romania
- Russia
- Thailand
- Turkey
- Ukraine
- United States
- Uzbekistan
- Viet Nam
- South Africa
- Zambia
- Kyrgyzstan
Authors: 超级管理员 | Edit: zhuliang
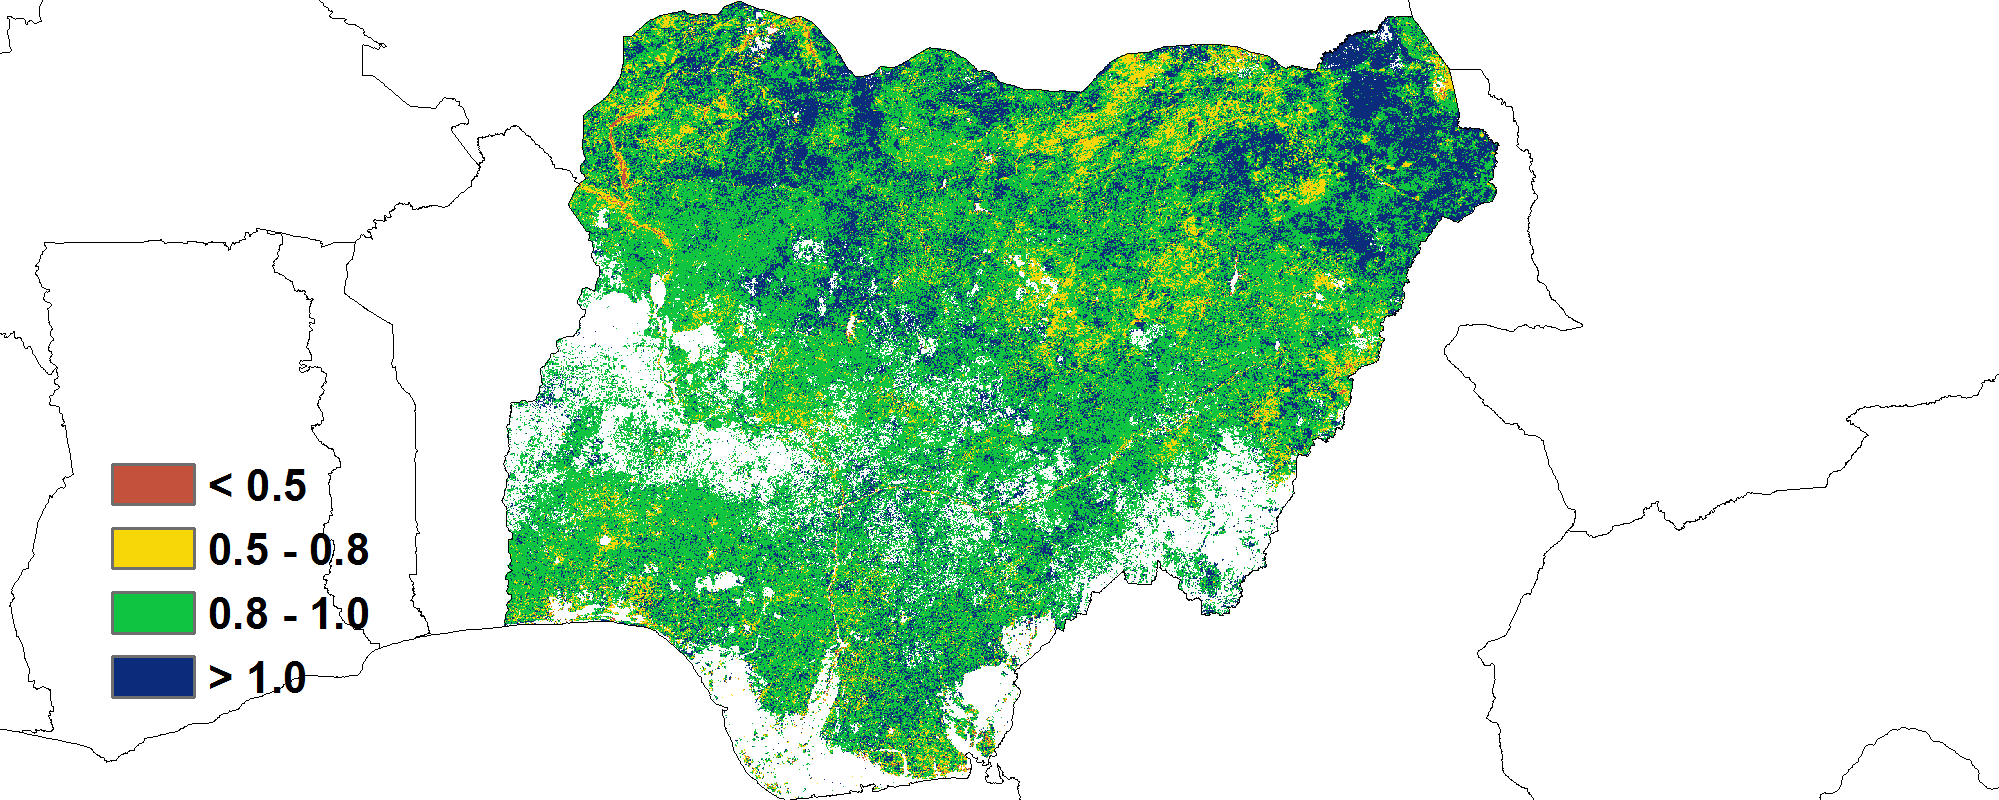
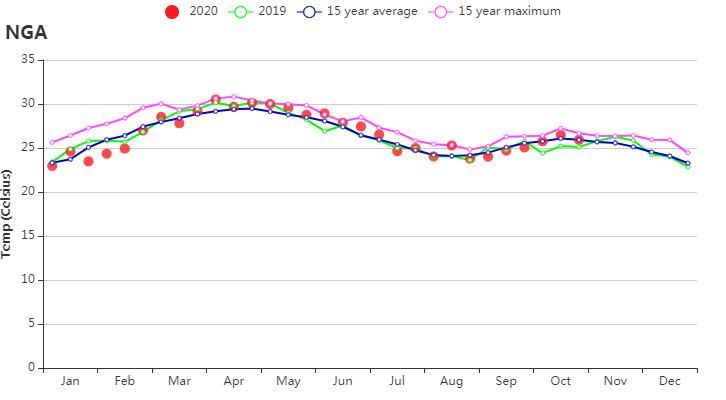
The current reporting period covers the harvest of main season maize and sorghum in the south. The soybean growing season spanned from June to October. Across the country, rainfall was 708 mm and the temperature was 25.1 ºC. The radiation was 1080 MJ/m² (-1%), while the estimated biomass was 667 gDM/m², which was below the 15YA (-4%). Cropping intensity was 122% (-3%). CALF was 94 (+1%) and the vegetation condition was at 0.93. The NDVI development curve was generally below average, but improved to average conditions by the end of this monitoring period. Crop conditions were mostly unfavorable, especially in the derived savanna and humid forest zones due to a lack of rainfall.
Regional analysis
The CropWatch analysis is done for four agro-ecological zones in Nigeria; the Sudano-Sahel which is the driest zone located in the north, the Guinea savanna and Derived savanna,both in the center, and the Humid forest zone in the south.
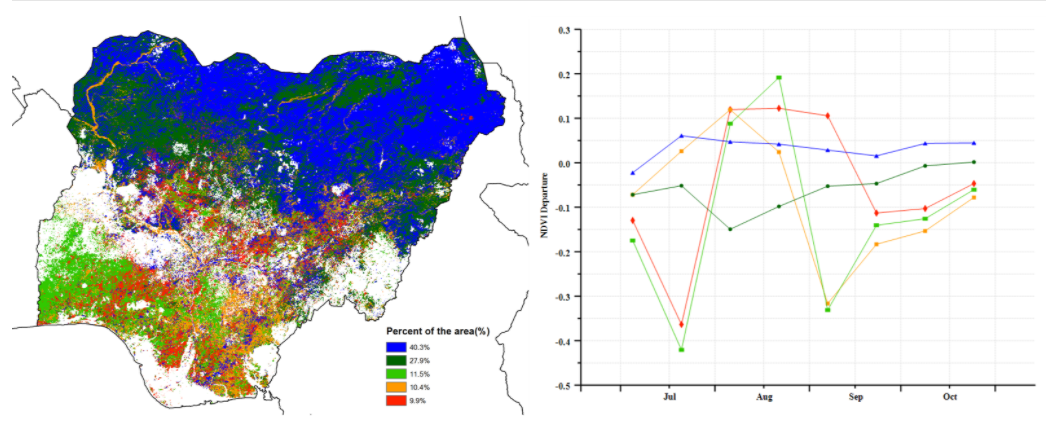
In the the Sudano-Sahelian zone, the observed rainfall was much lower than average (290 mm, -37%), temperature was 27.8 ºC (-0.1 ºC) and radiation was slightly lower (-4%) as compared to the 15YA. These climate conditions resulted in a biomass of 670 gDM/m² (-7% of departure from 15YA) while CALF was 86% (+3%) and VCIx was 95. The NDVI graph shows that from July up to August, NDVI values were slightly below average and subsequently fluctuated around the average.
In the Guinean savanna, recorded precipitation was 585 mm, a 29% drop as compared to the 15YA. Temperature was close to the average of 24.8 ºC (-0.1 ºC). The radiation was 1124 MJ/m2 (-2%), the biomass was 666 gDM/m² (-8 %) and CALF was 99, with no departure from the 15YA. Vegetation condition index was at 0.93. Based on the NDVI development graph, crop conditions stayed below average throughout most of this monitoring period, but reached the 5YA in October.
In the Derived savanna zone, rainfall was also much below average at 794 mm (-26%), the temperature was 24.2 ºC (+0.1 ºC) and the radiation was 1064 MJ/m2, a +1% increase as compared to the 15 YA. The estimated biomass was 685 gDM/m² (+1%). The cropped land was at 99, and the vegetation condition index was 0.93. The NDVI profile graph shows that values trended below average for the whole period.
In the Humid forest zone, rainfall was 1236 mm (-22%), the temperature was 24 ºC (-0.1ºC) and the radiation increased by 1% above the 15YA. Average values were observed for biomass at 633 gDM/m² (+1%) and CALF was 97% (+1%). The vegetation condition index (VCIx) in this region was at 92. The crop development graph based on NDVI indicates below-average crop conditions for the entire monitoring period.

(a) Phenology of main Crop

(b) Crop condition development graph based on NDVI (c) Maximum VCI
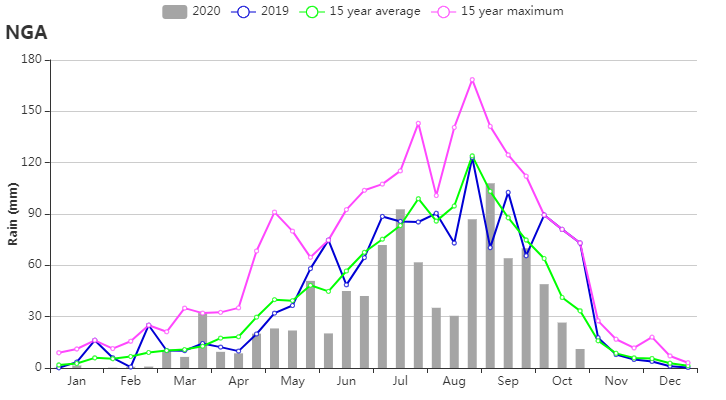
Figure.X Click to edit
(d) Rainfall index (e) Temperature index
(f) Spatial NDVI patterns compared to 5YA (g) NDVI profiles
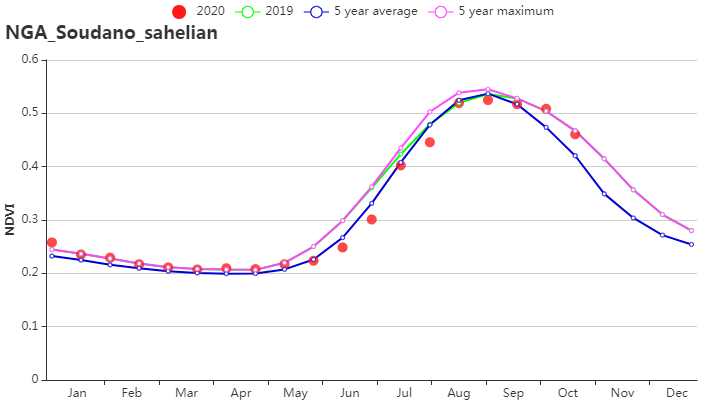
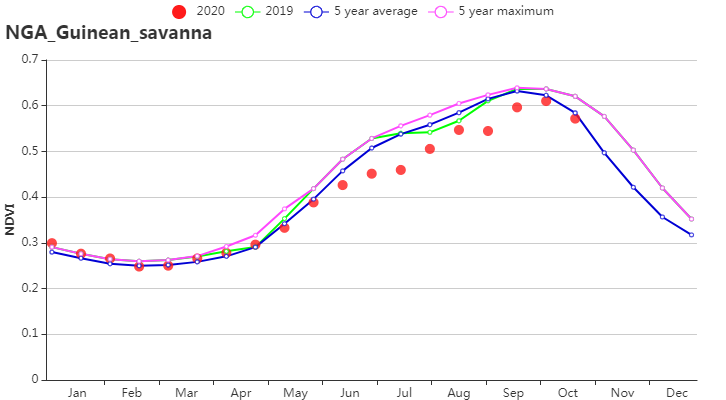
(h) Crop condition development graph based on NDVI (Soudano‐Sahelian region (left) and Guinean savanna (right))
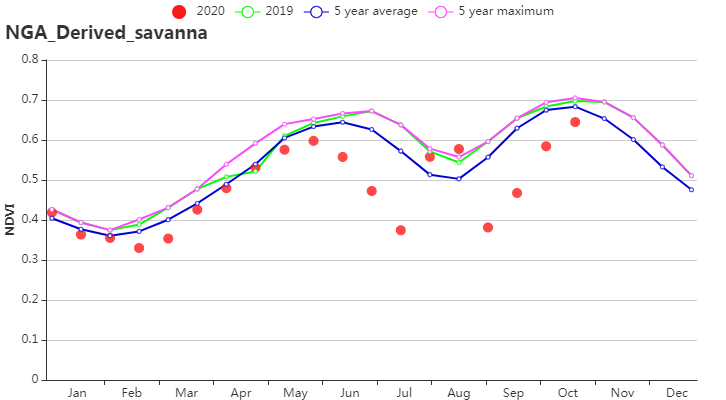
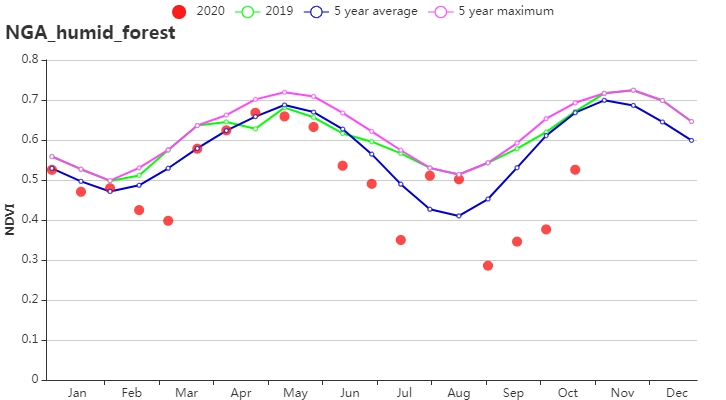
(i) Crop condition development graph based on NDVI (derived Savanna (left) and Humid forest zone (right)
Country agro-climatic indicators by sub‐national regions, current season's values and departure from 15YA, July - October 2020
Region | RAIN | TEMP | RADPAR | BIOMSS | |||||||
Current (mm) | Departure from 15YA (%) | Current (°C) | Departure from 15YA (°C) | Current (MJ/m2) | Departure from 15YA (%) | Current (gDM/m2) | Departure from 15YA (%) | ||||
NGA_Derived_savanna | 794 | -26 | 24.2 | 0.1 | 1064 | 1 | 685 | 1 | |||
NGA_Guinean_savanna | 585 | -29 | 24.8 | -0.1 | 1124 | -2 | 666 | -8 | |||
NGA_humid_forest | 1236 | -22 | 24.1 | -0.1 | 955 | 1 | 633 | 1 | |||
NGA_Soudano_sahelian | 290 | -37 | 27.8 | -0.1 | 1156 | -4 | 670 | -7 | |||
Country agronomic indicators by sub-national regions, current season's values and departures, 15YA, July - October 2020
Region | Cropped arable land fraction | Cropping Intensity | Maximum VCI | ||
Current (%) | Departure from 5YA (%) | Current (%) | Departure from 5YA (%) | Current | |
NGA_Derived_savanna | 99 | 0 | 157 | -7 | 0.93 |
NGA_Guinean_savanna | 99 | 0 | 106 | -2 | 0.93 |
NGA_humid_forest | 97 | 1 | 178 | -2 | 0.92 |
NGA_Soudano_sahelian | 86 | 3 | 100 | 0 | 0.95 |
