
Bulletin
wall bulletinMenu
- Overview
- Country analysis
- Afghanistan
- Angola
- Argentina
- Australia
- Bangladesh
- Belarus
- Brazil
- Canada
- Germany
- Egypt
- Ethiopia
- France
- United Kingdom
- Hungary
- Indonesia
- India
- Iran
- Italy
- Kazakhstan
- Kenya
- Cambodia
- Sri Lanka
- Morocco
- Mexico
- Myanmar
- Mongolia
- Mozambique
- Nigeria
- Pakistan
- Philippines
- Poland
- Romania
- Russia
- Thailand
- Turkey
- Ukraine
- United States
- Uzbekistan
- Viet Nam
- South Africa
- Zambia
- Kyrgyzstan
Authors: 超级管理员 | Edit: zhuliang
This monitoring period covers the harvesting period of three crops: Maize (October), spring wheat (August) and winter wheat (July-August), as well as the main growing period of maize (July-September) and the sowing period of winter wheat (September-October). Compared to the average of the last 15 years, the national-scale rainfall and average temperatures in Poland during the monitoring period were higher by 13% and 0.5°C respectively, while sunshine (RADPAR) was lower by 3%. Estimated BIOMSS was lower by 5%, due to cloudy conditions. CALF was close to the average of the last 5 years and up to 100%. VCIx was 0.99.
As shown in the graph of crop growth, NDVI was close to the average of the last 5 years during the entire monitoring period, with temperatures being lower in July and higher after August, and rainfall being slightly below average from July to August and significantly higher in September-October, compared to the average of the last 15 years. VCIx was above 0.8 for the entire country. The NDVI cluster map shows that NDVI on 25.2% (blue) of the country's cropland was above average throughout the monitoring period, 15.5% (dark green) was below average and 32.3% (red) was significantly above average in July and close to average after August, and the rest of the cropland was characterized by fluctuating changes.
Overall, crop conditions are satisfactory, but October's heavy rainfall may have had a negative impact on winter wheat planting and maize harvesting.
Regional analysis
Poland is divided into four subregions based on agro-ecological characteristics, namely: (a) Northern oats and potatoes area (including the Western Pomeranian, Eastern Pomeranian and Wamenia-Masuria regions), (b) Northern-central wheat and sugar-beet area (including the Cuyavia-Pomeranian to Baltic Sea region), (c) Central rye and potatoes area (including the Lubus to South Podlaski and North Lublin regions) and (d) Southern wheat and sugar-beet area (including the southern Lower Silesia to South Lublin and the Carpathian along the Czech and Slovak border).
In the Northern oats and potatoes area temperature was higher by 0.6°C, while rainfall and RADPAR were lower by 11% and 4% respectively and potential biomass was 8% lower than the average of the last 15 years. Lower rainfall mainly occurred before mid-August, while the NDVI was also below average in August, but due to good soil moisture conditions in the early stages, it did not adversely affect the summer crop harvest, and the rainfall was abundant after September. The moisture content of the soil was conducive to the cultivation of winter crops. VCIx in the subregion reached 1.00, CALF was close to 100%. In general, crop growth was satisfactory.
In Northern-central wheat and sugar-beet area and Central rye and potatoes area, rainfall was 4% to 6% higher and temperatures were 0.5°C higher in both subregions and were also above the average of the last 15 years. But RADPAR was 3-4% lower and potential biomass was 4-8% lower. Both subregions were characterized by cool and dry weather in July and above-average rainfall and temperatures after August, which favored crop growth. VCIx for both subregions were close to 1.0 and CALF approached 100%. Overall, agronomic conditions were favorable for crop growth in both areas.
Compared to the average of the last 15 years, rainfall in the Southern wheat and sugar-beet area was significantly higher by 35%, temperature was slightly higher by 0.3°C, and RADPAR and BIOMSS were lower by 4% and 3%, respectively. Rainfall in the region was consistently above average levels, and in mid-September and mid-October, it was even close to the highest levels of the past 15 years, which favors winter crops, but may be detrimental to the harvesting of summer crops and the planting of winter crops.

图.X 7_10_POL
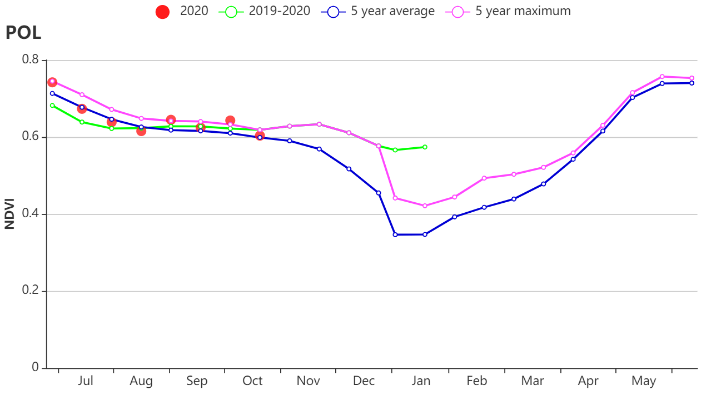
图.X Crop condition development graph based on NDVI
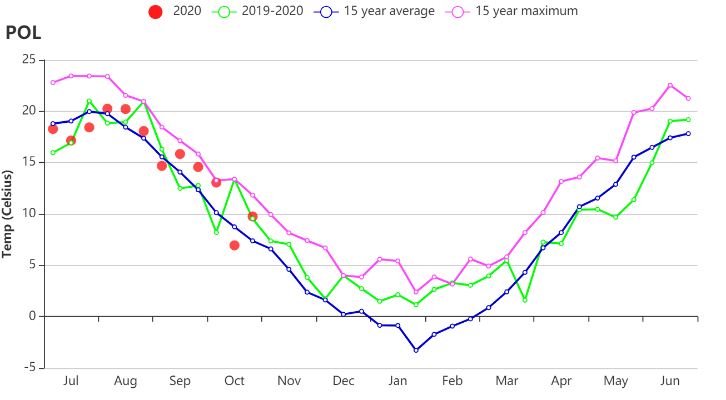
图.X Time series temperature profile
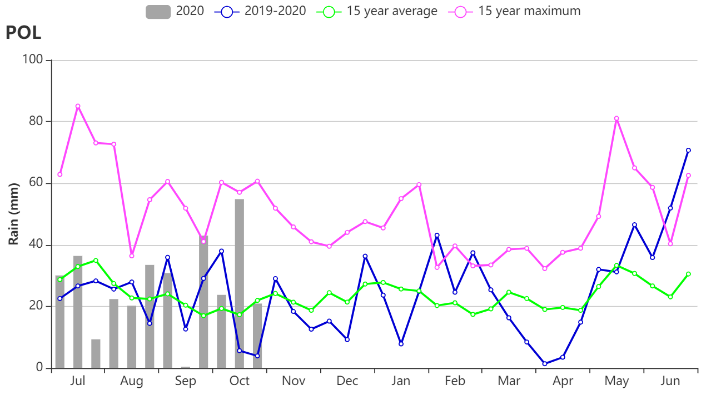
图.X Time series rainfall profile
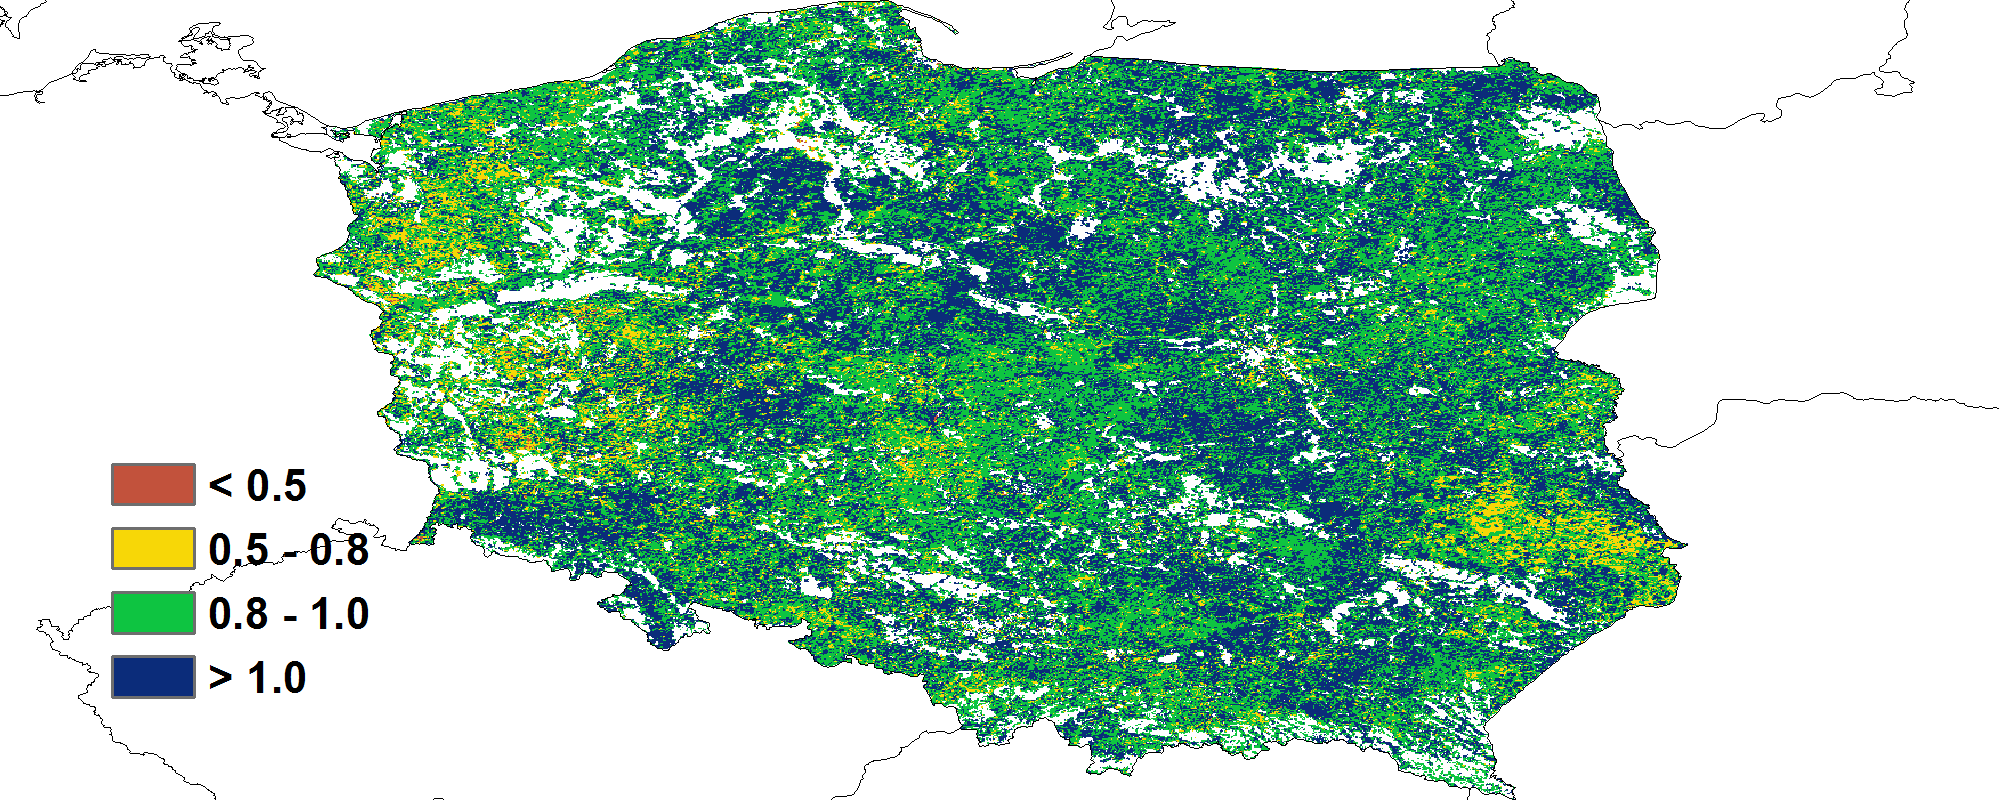
图.X Maximum VCI
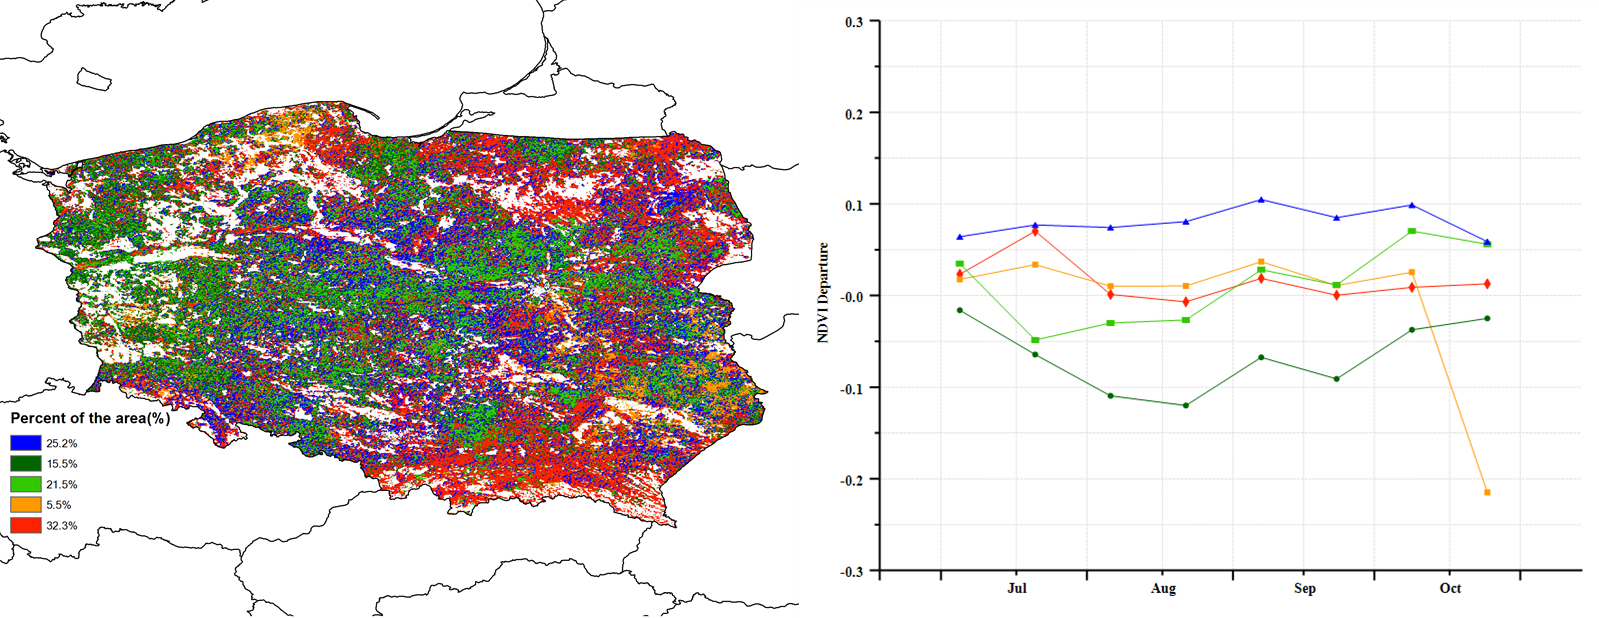
图.X Spatial distribution of NDVI profiles
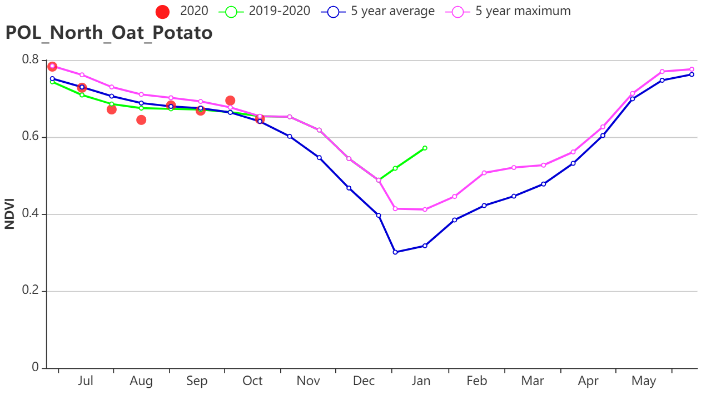
图.X Crop condition development graph based on NDVI
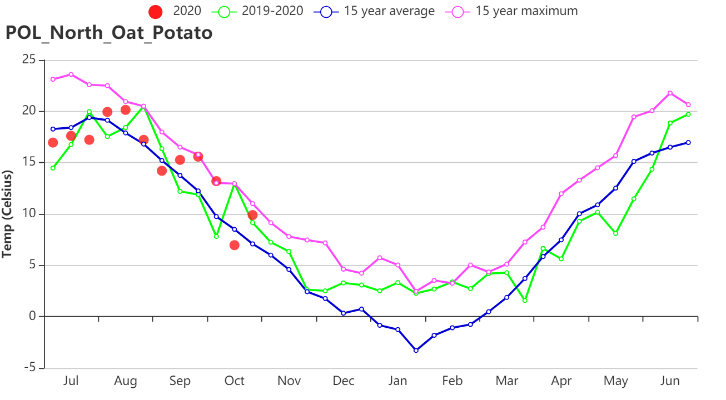
图.X Time series temperature profile
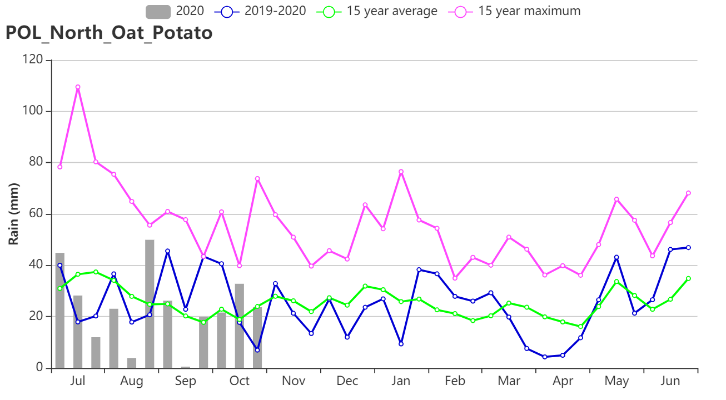
图.X Time series rainfall profile
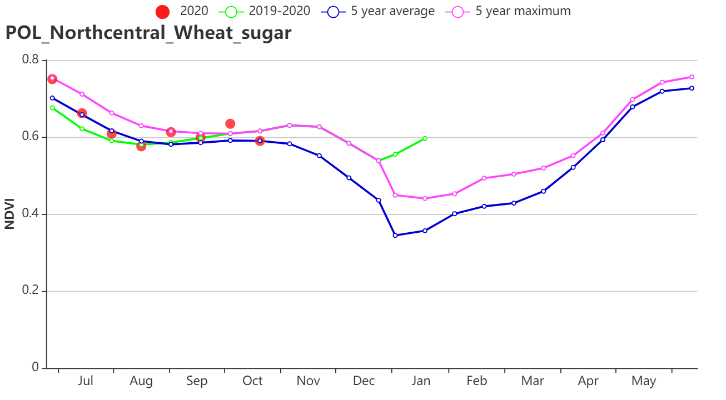
图.X Crop condition development graph based on NDVI
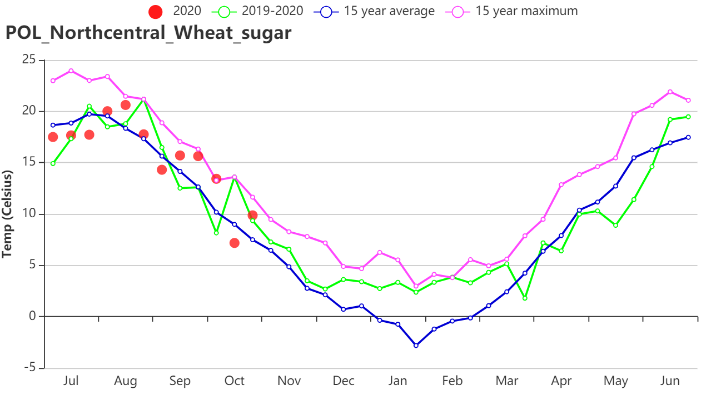
图.X Time series temperature profile
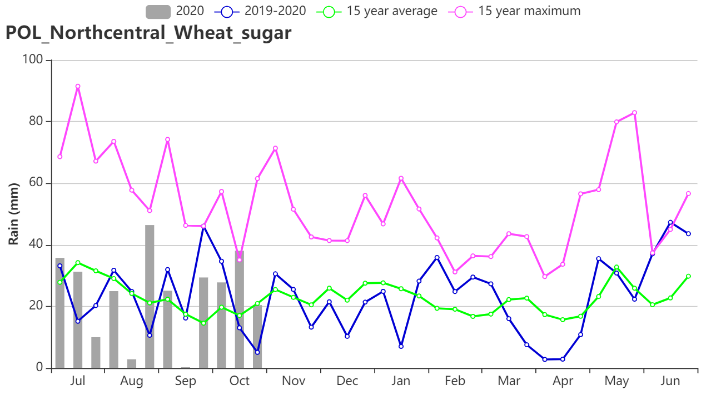
图.X Time series rainfall profile
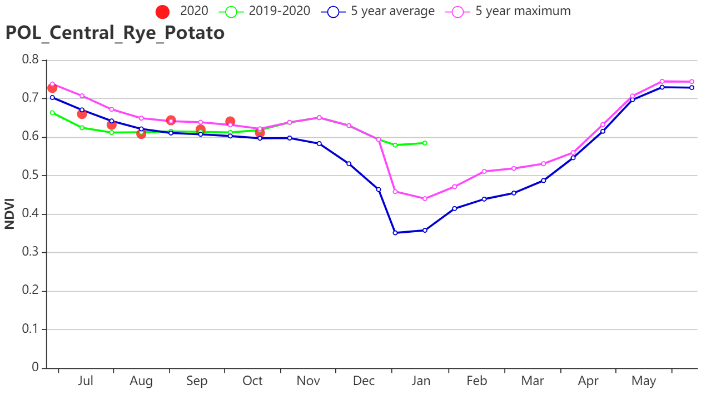
图.X Crop condition development graph based on NDVI
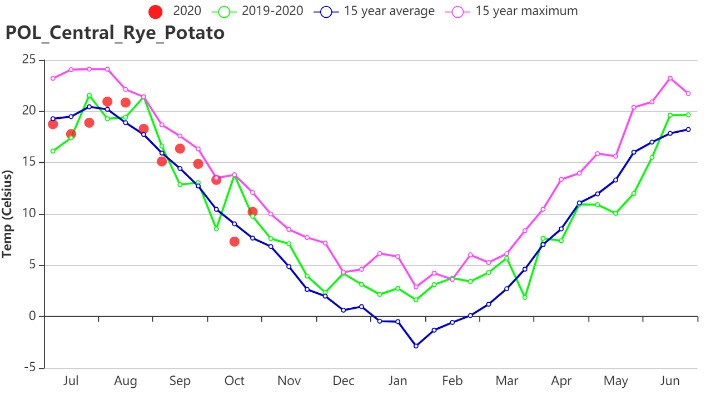
图.X Time series temperature profile
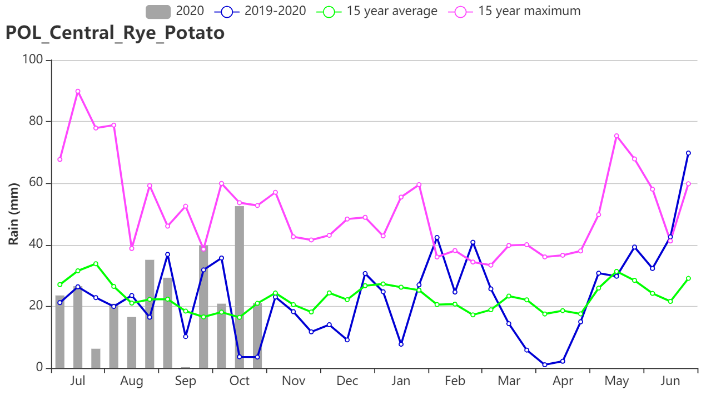
图.X Time series rainfall profile
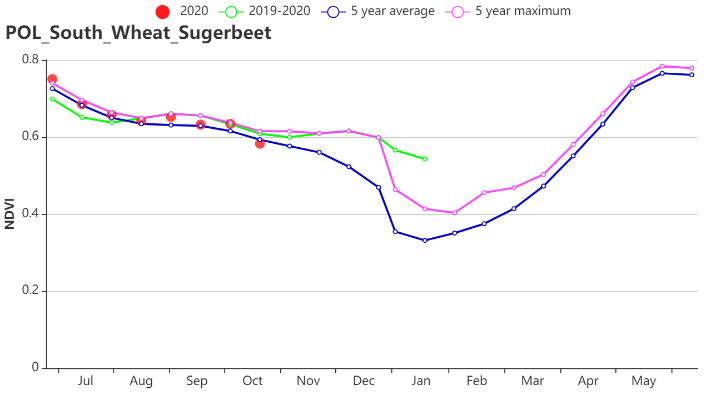
图.X Crop condition development graph based on NDVI
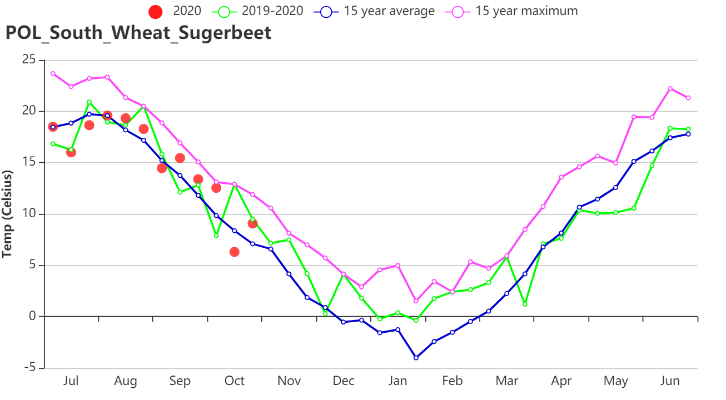
图.X Time series temperature profile
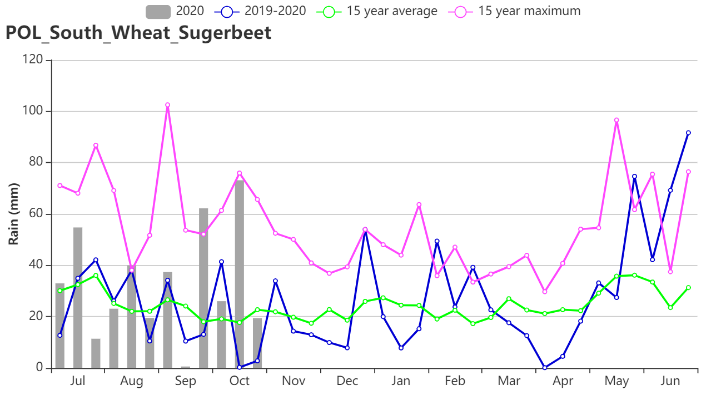
图.X Time series rainfall profile
Table 3.61. Poland agroclimatic indicators by agro-ecological region, current season's values and departure from 15YA, July - October 2020
| Region | RAIN | TEMP | RADPAR | BIOMSS | ||||
| Current(mm) | Departure from 15YA (%) | Current (°C) | Departure from 15YA (°C) | Current (MJ/m2) | Departure from 15YA (%) | Current (gDM/m2) | Departure from 15YA (%) | |
| Northern oats and potatoes area | 287 | -11 | 15.4 | 0.6 | 774 | -4 | 326 | -8 |
| Northern-central wheat and sugarbeet area | 292 | 4 | 15.6 | 0.5 | 789 | -4 | 339 | -8 |
| Central rye and potatoes area | 293 | 6 | 16.1 | 0.5 | 817 | -3 | 372 | -4 |
| Southern wheat and sugarbeet area | 400 | 35 | 15.1 | 0.3 | 864 | -4 | 381 | -3 |
Table 3.62. Poland agronomic indicators by agro-ecological region, current season's values and departure from 5YA, July - October 2020
| Region | Cropped arable land fraction | Cropping Intensity | Maximum VCI | ||
| Current (%) | Departure from 5YA (%) | Current(%) | Departure from 5YA (%) | Current | |
| Northern oats and potatoes area | 100 | 0 | 103 | 1 | 1.00 |
| Northern-central wheat and sugarbeet area | 100 | 0 | 104 | -3 | 1.00 |
| Central rye and potatoes area | 100 | 0 | 106 | -2 | 0.98 |
| Southern wheat and sugarbeet area | 100 | 0 | 110 | 6 | 0.99 |
