 English
 中文
中文
Bulletin
wall bulletinMenu
- Overview
- Country analysis
- Afghanistan
- Angola
- Argentina
- Australia
- Bangladesh
- Belarus
- Brazil
- Canada
- Germany
- Egypt
- Ethiopia
- France
- United Kingdom
- Hungary
- Indonesia
- India
- Iran
- Italy
- Kazakhstan
- Kenya
- Cambodia
- Sri Lanka
- Morocco
- Mexico
- Myanmar
- Mongolia
- Mozambique
- Nigeria
- Pakistan
- Philippines
- Poland
- Romania
- Russia
- Thailand
- Turkey
- Ukraine
- United States
- Uzbekistan
- Viet Nam
- South Africa
- Zambia
- Kyrgyzstan
Authors: 超级管理员 | Edit: yannn
La Niña condition prevailed across the Pacific Ocean. Figure 5.8 illustrates the behavior of the standard Southern Oscillation Index (SOI) published by the Australian Bureau of Meteorology (BOM) for the period from January 2020 to January 2021. Sustained positive values of the SOI above +7 typically indicate La Niña while sustained negative values below -7 typically indicate El Niño. Values between about +7 and -7 generally indicate neutral conditions. During this monitoring period, SOI increased from 4.2 in October to 9.2 in November, then increased to 16.9 in December, then decreased to 16.5 in January, indicating a La Niña has developed.
The 2020-2021 La Niña event has passed its peak, but impacts on temperatures, precipitation and storm patterns continue, according to a new update from the World Meteorological Organization (WMO). Despite the general cooling influence of La Niña events, land temperatures are expected to be above-normal for most parts of the globe in February-April 2021. La Niña has a temporary global cooling effect. But this was not enough to prevent 2020 from being one of the three warmest years on record. La Niña and El Niño effects on average global temperature are typically strongest in the second year of the event, but it remains to be seen to what extent the current La Niña will influence global temperatures in 2021.
The sea surface temperature anomalies in January values of the three key NINO indices were: NINO3 -0.4°C, NINO3.4 -0.8°C, and NINO4 -0.9°C, respectively, somewhat colder than the 1961-1990 average according to BOM (see Figure 5.9 and Figure 5.10). La Niña has developed and is expected to last into next year, affecting temperatures, precipitation and storm patterns in many parts of the world, according to the World Meteorological Organization (WMO).

Figure 5.7 Monthly SOI-BOM time series from January 2020 to January 2021 (Source: http://www.bom.gov.au/climate/current/soi2.shtml)
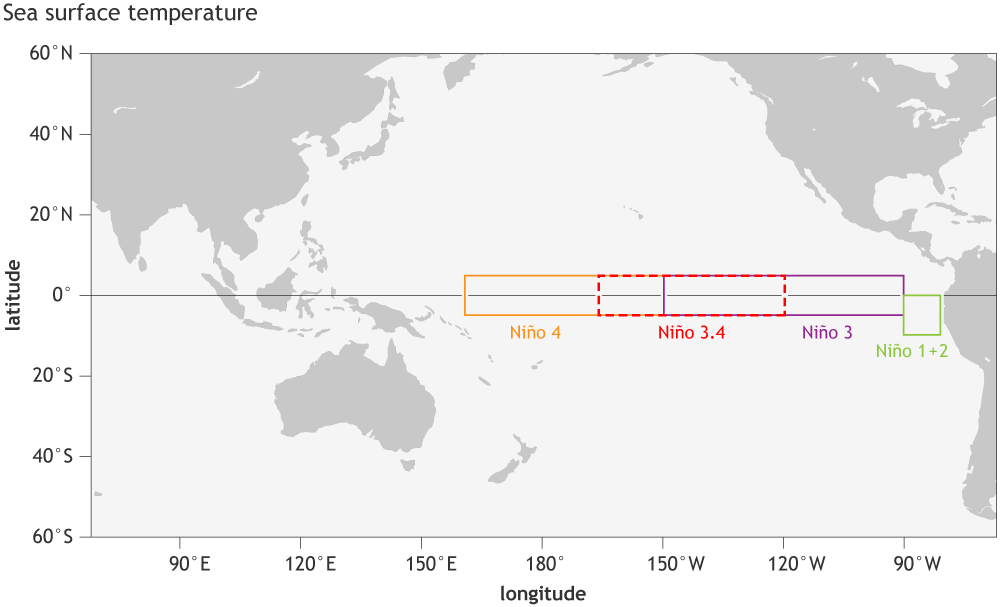
Figure 5.8 Map of NINO Region (Source: https://www.climate.gov/sites/default/files/Fig3_ENSOindices_SST_large.png)

Figure 5.9 January 2021 sea surface temperature departure from the 1961-1990 average (Source:http://www.bom.gov.au/climate/enso/wrap-up/archive/20210216.ssta_pacific_monthly.png?popup)