 English
 中文
中文
Bulletin
wall bulletinMenu
- Overview
- Country analysis
- Afghanistan
- Angola
- Argentina
- Australia
- Bangladesh
- Belarus
- Brazil
- Canada
- Germany
- Egypt
- Ethiopia
- France
- United Kingdom
- Hungary
- Indonesia
- India
- Iran
- Italy
- Kazakhstan
- Kenya
- Cambodia
- Sri Lanka
- Morocco
- Mexico
- Myanmar
- Mongolia
- Mozambique
- Nigeria
- Pakistan
- Philippines
- Poland
- Romania
- Russia
- Thailand
- Turkey
- Ukraine
- United States
- Uzbekistan
- Viet Nam
- South Africa
- Zambia
- Kyrgyzstan
- Syria
- Mauritius
- Algeria
Authors: 超级管理员 | Edit: Changsheng
This reporting period covers the main growing season of winter wheat, sown in September and October. According to the crop condition development graph, NDVI values were above average in January, but below average from February to April due to below-average temperatures (TEMP -0.9°C). The overall rainfall in this period was below average (RAIN -11%), as well as solar radiation (RADPAR -1%) as compared to the 15YA. The low rainfall was mainly due to below-average rainfall starting mid-February, which delayed the growth of winter wheat, resulting in a -8% decrease of estimated biomass. The national CALF was 94%, which was -4% below the 5YA. Rainfall had recovered to average levels by late April and average winter wheat production can still be expected.
The national average VCIx was 0.81. The NDVI departure cluster profiles indicate that: 32% of arable land experienced above-average crop conditions, mainly distributed in the east Hungary and west Hungary. 41% of arable land experienced slightly below-average crop conditions, scattered over the whole Hungary. Most likely, the large drops can be attributed to cloud cover in the satellite images and snow, but with low precipitation since mid-February, 68% of the NDVI pixels were below average starting from mid-March.
Regional analysis
Based on cropping systems, climatic zones, and topographic conditions, four sub-national regions are described below: Central Hungary, the Great Plain (Puszta), Northern Hungary and Transdanubia. During this reporting period, CALF was below average for all the four subregions (-7%, -6%, -2% and -3%, respectively).
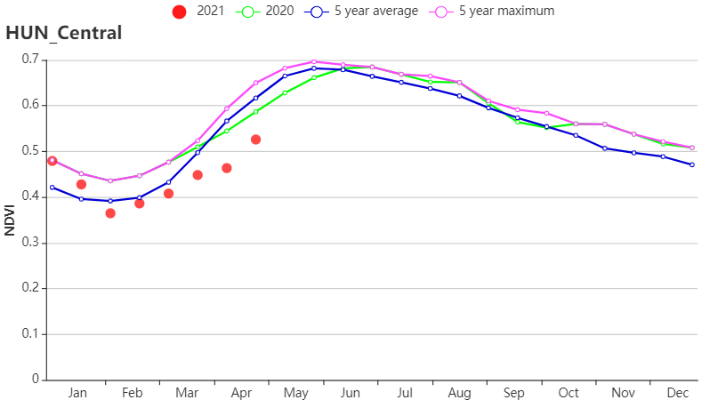
Central Hungary is one of the major agricultural regions in terms of crop production. A sizable share of winter wheat is planted in this region. According to the NDVI development graphs, the values were above average in January, but below average from February to April due to the low precipitation between mid-February and early April. Agro-climatic conditions include below-average rainfall (RAIN -13%) and temperature (TEMP -1.1°C), and above-average radiation (RADPAR 2%), which resulted in below-average biomass (BIOMSS -4%). The VCIx was 0.77. The crop conditions in this region are slightly below average.
The Puszta region mainly grows winter wheat, maize and sunflower, especially in the counties of Jaz-Nagykum-Szolnok and Bekes. According to the NDVI development graphs, the values were above average in January and February, but below average in March and April due to the low precipitation from mid-February to early April. Agro-climatic conditions include below-average rainfall (RAIN -2%) and temperature (TEMP -1.0°C), and radiation (RADPAR -2%), which resulted in a below-average biomass (BIOMSS -8%). The maximum VCI was 0.81. The crop conditions in this region are slightly below average.
Northern Hungary is another important winter wheat region. According to the NDVI development graphs, the values were above average in January, but below average from February to April due to the low precipitation from mid-February to early April. The rainfall was above average (RAIN +3%). Temperature was slightly below average (TEMP -1.3°C), and radiation was below average (RADPAR -2%). Estimated biomass decreased (BIOMSS -5%). The maximum VCI was 0.80. The crop conditions in this region are slightly below average.
Southern Transdanubia cultivates winter wheat, maize, and sunflower, mostly in Somogy and Tolna counties. According to the NDVI development graphs, the values were above average in January, but below average from February to April due to the low precipitation from mid-February to early April. Agro-climatic conditions include below-average rainfall (RAIN -27%) and temperature (TEMP -0.7°C), which resulted in a below-average biomass (BIOMSS -10%). The maximum VCI was favorable at 0.83. The crop conditions in this region are slightly below average.
Figure.3.18 Hungary’s crop condition, January 2021-April 2021
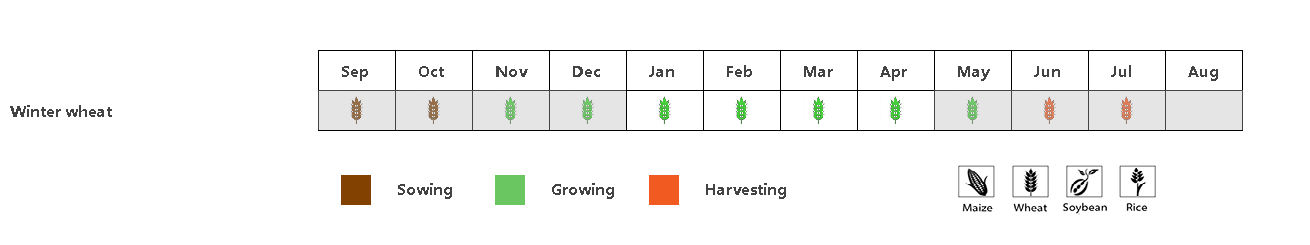
(a). Phenology of major crops

(b) Maximum VCI
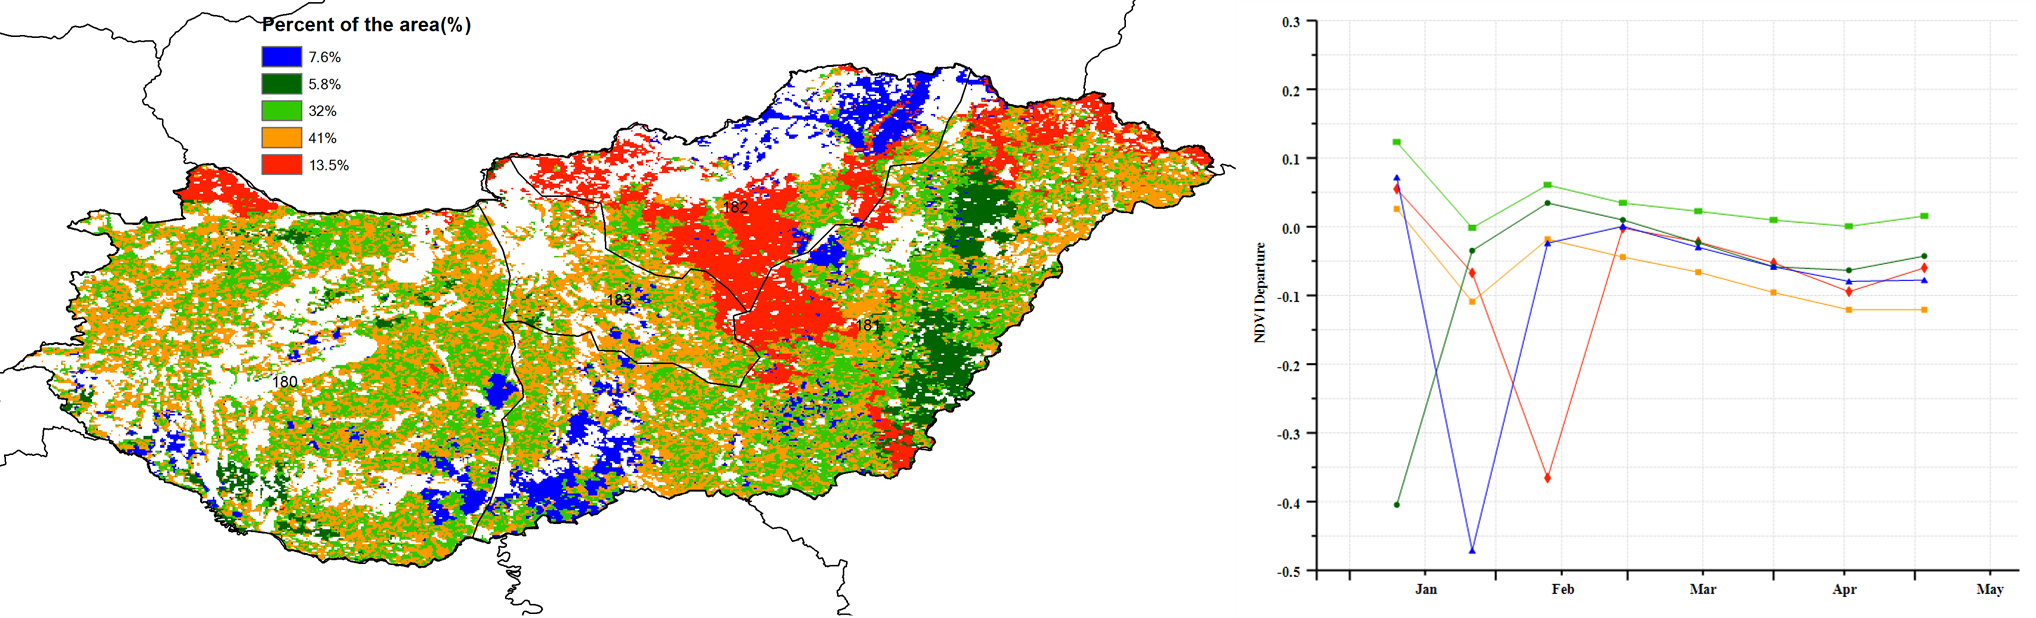
(c) Spatial distribution of NDVI profiles
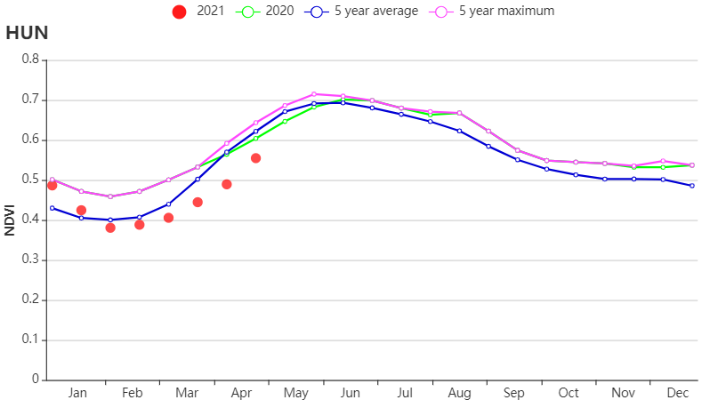

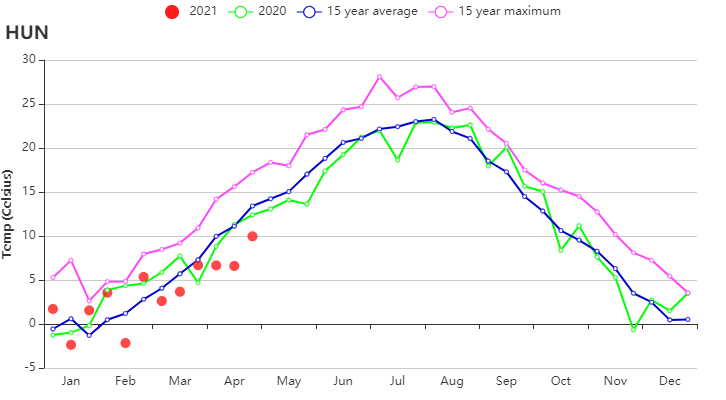
(d) Crop condition development graph based on NDVI, Time series rainfall pofile and temperature profile
![]()
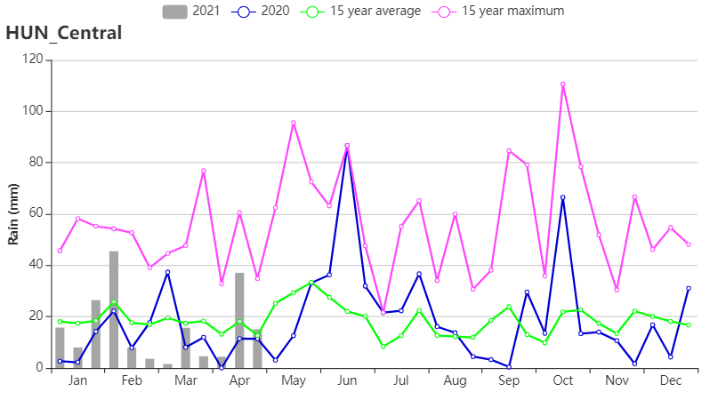
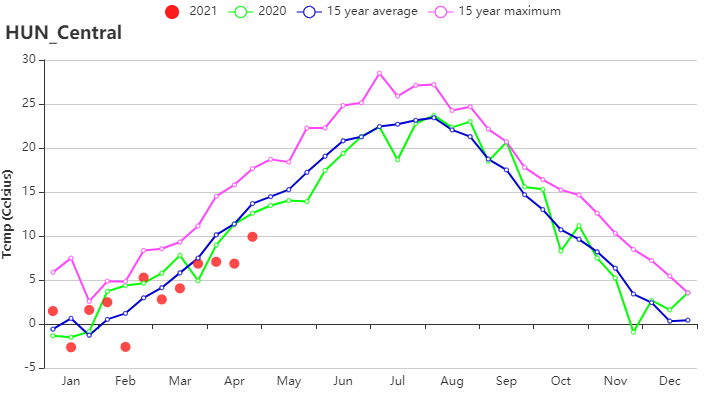
(e) Crop condition development graph based on NDVI, Time series rainfall profile and temperature profile (Central Hungary)
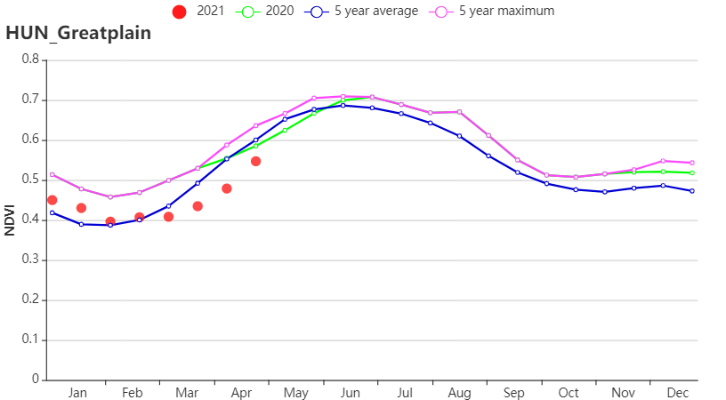

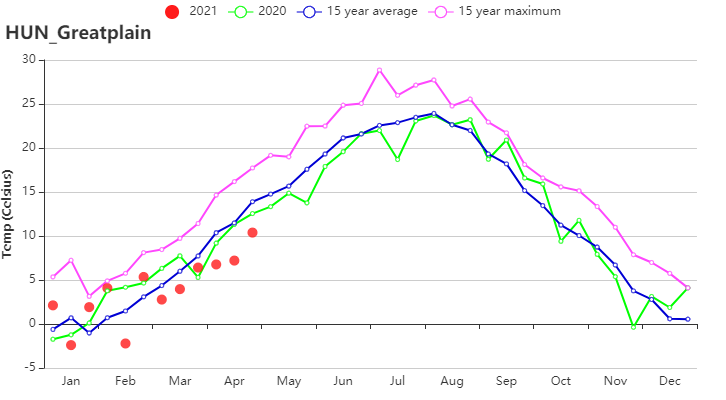
(f) Crop condition development graph based on NDVI, Time series rainfall pofile and temperature pofile(The Greatplain)

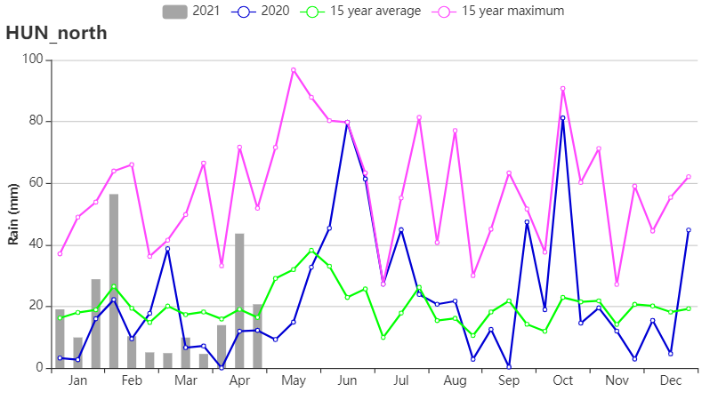
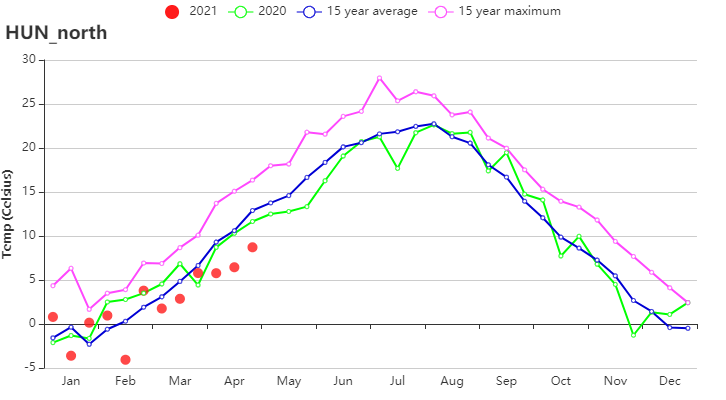
(g) Crop condition development graph based on NDVI, Time series rainfall profile and temperature profile (North Hungary)
![]()
![]()
![]()
(h) Crop condition development graph based on NDVI, Time series rainfall profile and temperature profile (Transdanubia)
Table 3.27 Hungary’s agroclimatic indicators by sub-national regions, current season's values and departure from 15YA, January - April 2021
RAIN | TEMP | RADPAR | BIOMSS
| |||||
Region | Current (mm) | Departure from 15YA (%) | Current (°C) | Departure from 15YA (°C) | Current (MJ/m2) | Departure from 15YA (%) | Current (gDM/m2) | Departure from 15YA (%) |
Central Hungary | 185 | -13 | 3.6 | -1.1 | 637 | 2 | 480 | -4 |
North Hungary | 227 | 3 | 2.4 | -1.3 | 588 | -2 | 484 | -8 |
The Puszta | 235 | -2 | 3.9 | -1.0 | 609 | -2 | 464 | -5 |
Transdanubia | 168 | -27 | 4.0 | -0.7 | 650 | 0 | 460 | -10 |
Table 3.28 Hungary’s agronomic indicators by sub-national regions, current season's values and departure from 5YA, January - April 2021
CALF | Maximum VCI | ||
Region | Current(%) | Departure from 5YA (%) | Current |
Central Hungary | 91 | -7 | 0.77 |
North Hungary | 97 | -2 | 0.80 |
The Puszta | 89 | -6 | 0.81 |
Transdanubia | 93 | -3 | 0.83 |