 English
 中文
中文
Bulletin
wall bulletinMenu
- Overview
- Country analysis
- Afghanistan
- Angola
- Argentina
- Australia
- Bangladesh
- Belarus
- Brazil
- Canada
- Germany
- Egypt
- Ethiopia
- France
- United Kingdom
- Hungary
- Indonesia
- India
- Iran
- Italy
- Kazakhstan
- Kenya
- Cambodia
- Sri Lanka
- Morocco
- Mexico
- Myanmar
- Mongolia
- Mozambique
- Nigeria
- Pakistan
- Philippines
- Poland
- Romania
- Russia
- Thailand
- Turkey
- Ukraine
- United States
- Uzbekistan
- Viet Nam
- South Africa
- Zambia
- Kyrgyzstan
- Syria
- Mauritius
- Algeria
Authors: 超级管理员 | Edit: Changsheng
This report covers the main growing season (Maha) and the harvesting of rice and maize from January to March, as well as the second season (Yala) early sowing of the crops in April. According to the CropWatch monitoring results, crop conditions were generally close to average for the monitoring period.
During this period, the country experienced the northeastern monsoon from January to February with cold and dry weather, as well as the first inter-monsoon rains from March to April with warm and wet conditions. At the national level, precipitation was significantly above the 15YA (RAIN +26%), temperature was average while radiation experienced a minor decrease (RADPAR -2%). The increase of rainfall mainly occurred in January, which ensured sufficient water supply for the crops and further contributed to the good crop condition. All of these indicators lead to an increase of BIOMSS (BIOMSS,
13%). The fraction of cropped arable land (CALF) was comparable to the 5YA. As shown in NDVI development graph, NDVI was generally close to average during the period, but was slightly below average in March. According to the last bulletin, the abnormal low values in January are outliers that resulted from cloud cover. The maximum VCI for the whole country was 0.97.
As shown by the NDVI clusters map and profiles, nearly 90% of country's cropland showed near-zero NDVI departures during the whole period except for January, suggesting a favorable situation of crop conditions. 10.3% of cropland showed marked negative NDVI departures from February to early April. These croplands were mainly distributed along the east coast of the country, including most of Eastern Province and the areas around Polonnaruwa.
Regional analysis
Based on the cropping system, climatic zones and topographic conditions, three sub-national agroecological regions can be distinguished for Sri Lanka. They are the Dry zone, the Wet zone, and the Intermediate zone.
In the Dry zone, the recorded RAIN (581 mm) was 30% above average. TEMP was on average and RADPAR was down by 2%, while BIOMSS increased by 15% as compared to the 15YA. CALF was near the 5YA level with 99% of cropland utilized. NDVI followed a similar trend as the whole county. The VCIx for the zone was 0.96. Overall, crop conditions were near average for this zone.
For the Wet zone, RAIN (936 mm) was 20% above average as compared to the 15YA. TEMP was average and RADPAR dropped by 3%. BIOMSS was 8% above the 15YA and cropland was fully utilized. Apart from the outliers in January, NDVI values were close to average for the whole period. The VCIx value for the zone was 1.00. Crop conditions were favorable for this zone.
The Intermediate zone also experienced sufficient rain (842 mm) with a 28% increase from the 15YA. TEMP was 0.1°C slightly below average and RADPAR down by 4% compared to the 15YA. With full use of cropland, BIOMSS was 8% above average. The NDVI values were similar to the Wet zone and the VCIx value for this zone was 0.98. Conditions of crops were assessed as average.
Figure 3.27. Sri Lanka crop condition, January 2021 – April 2021
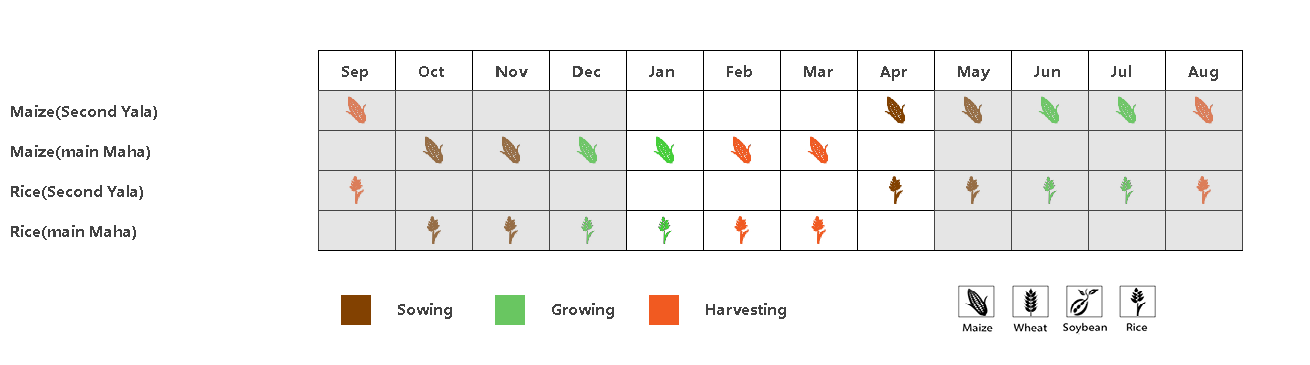
(a) Phenology of major crops
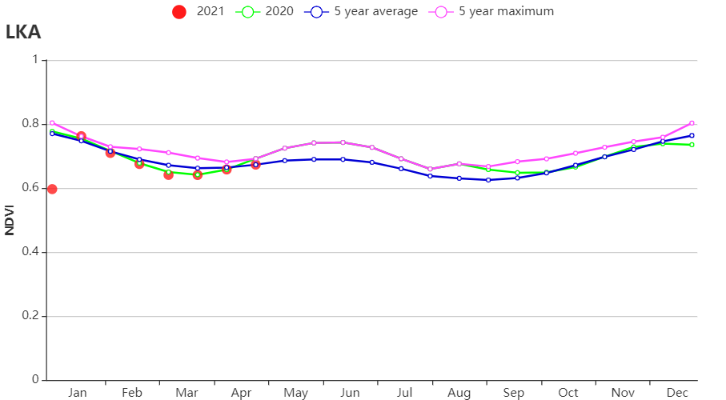
(b) Crop condition development graph based on NDVI
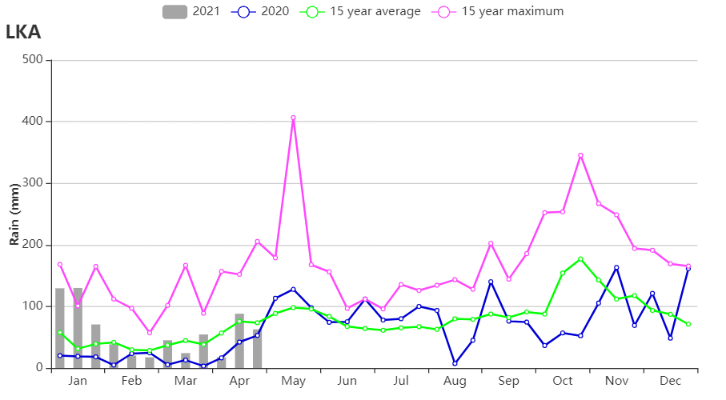
(c) Rainfall profile
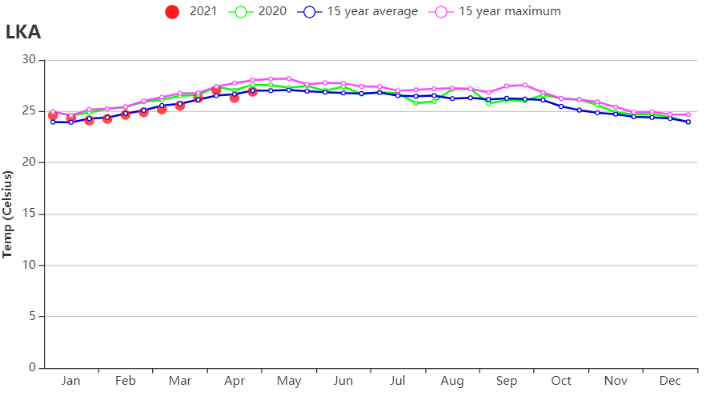
(d) Temperature profile

(e) Maximum VCI
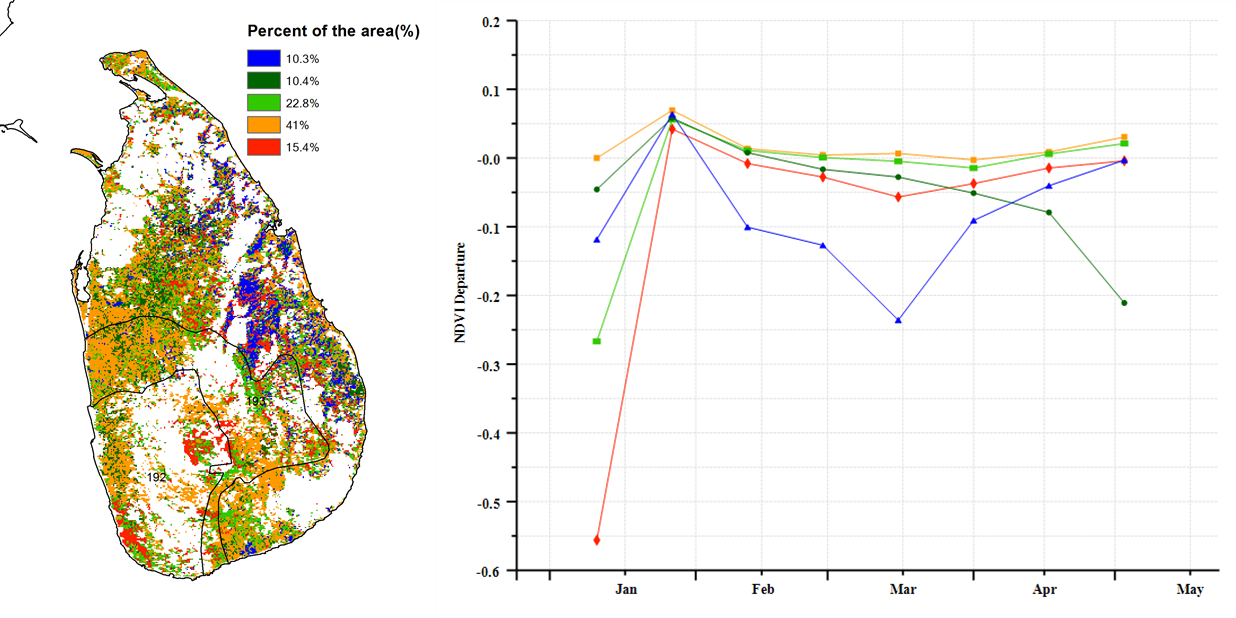
(f) Spatial NDVI patterns compared to 5YA (g) NDVI profiles
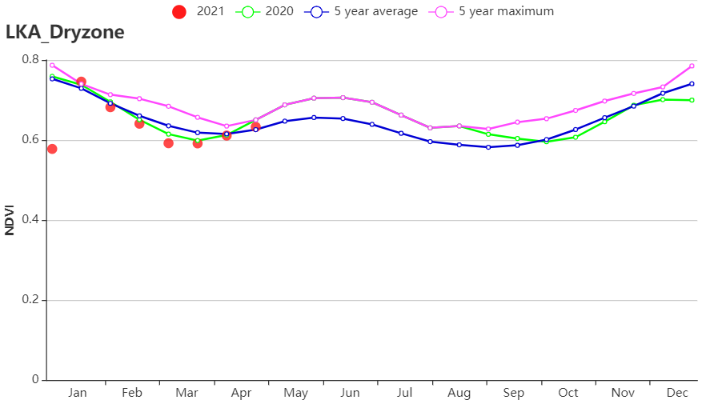
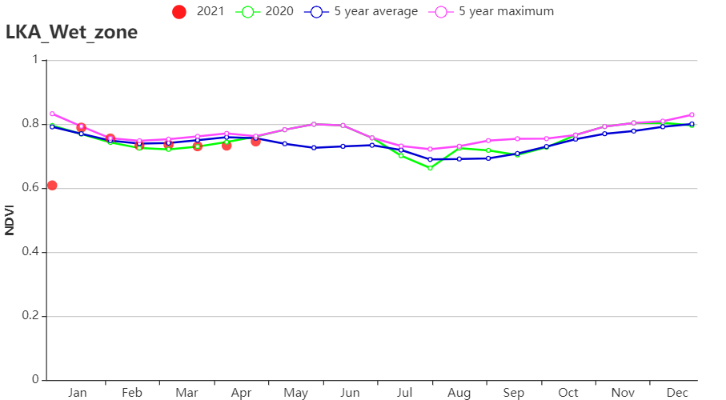
(h) Crop condition development graph based on NDVI (Dry zone (left) and Wet zone (right))
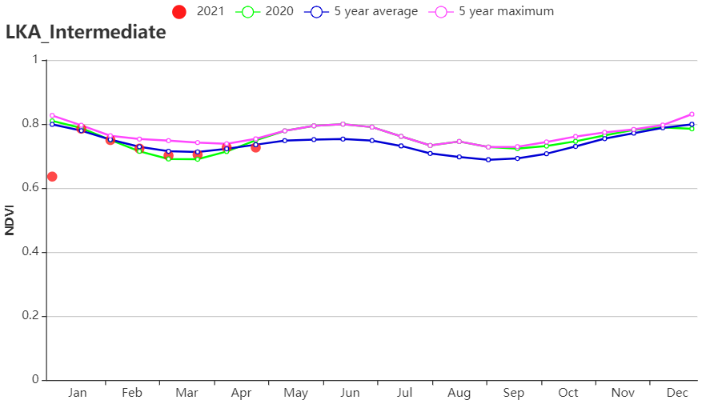
(i) Crop condition development graph based on NDVI (Intermediate zone)
Table 3.45. Sri Lanka agroclimatic indicators by sub-national regions, current season's values and departure from 15YA, January - April 2021
Region | RAIN | TEMP | PADPAR | BIOMASS | ||||
current (mm) | Departure from 15YA (%) | current (°C) | Departure from 15YA (°C) | current (MJ/m2) | Departure from 15YA (%) | current (gDM/m2) | Departure from 15YA (%) | |
Dry zone | 581 | 30 | 25.7 | 0.0 | 1251 | -2 | 1208 | 15 |
Wet zone | 936 | 20 | 24.7 | 0.0 | 1150 | -3 | 1246 | 8 |
Intermediate zone | 842 | 28 | 23.9 | -0.1 | 1130 | -4 | 1334 | 8 |
Table 3.46. Sri Lanka agronomic indicators by sub-national regions, current season's values and departure from 15YA/5YA, January - April 2021
Region | CALF | Maximum VCI | |
Current (%) | Departure from 5YA (%) | Current | |
Dry zone | 99 | 0 | 0.96 |
Wet zone | 100 | 0 | 1.00 |
Intermediate zone | 100 | 0 | 0.98 |