 English
 中文
中文
Bulletin
wall bulletinMenu
- Overview
- Country analysis
- Afghanistan
- Angola
- Argentina
- Australia
- Bangladesh
- Belarus
- Brazil
- Canada
- Germany
- Egypt
- Ethiopia
- France
- United Kingdom
- Hungary
- Indonesia
- India
- Iran
- Italy
- Kazakhstan
- Kenya
- Cambodia
- Sri Lanka
- Morocco
- Mexico
- Myanmar
- Mongolia
- Mozambique
- Nigeria
- Pakistan
- Philippines
- Poland
- Romania
- Russia
- Thailand
- Turkey
- Ukraine
- United States
- Uzbekistan
- Viet Nam
- South Africa
- Zambia
- Kyrgyzstan
Authors: 超级管理员 | Edit: mazh
In this period, the South and Southeast Asia winter crops were in the growing period and earlier planted crops were in the harvest period. The main crops grown in South and Southeast Asia were maize, rice, wheat and soybean. Most of India crops are under irrigation, rainfall plays limited roles on crop conditions. The Southeast Asia is experiencing dry season and most crops are also irrigated.
According to the CropWatch agroclimatic indicators, the temperature was unchanged compared with the 15YA. The RADPAR was above the 15YA (RADPAR +1%) and the accumulated precipitation was above the 15YA (RAIN+3%) which led to an increase in the potential biomass (BIOMSS +3%). CALF increased by 13% compared with the 5YA, reaching 87% and VCIx of the MPZ was 0.92.
According to the spatial distribution of rainfall profiles, the precipitation for 8.7% of the MPZ showed the highest positive departures in late January, located in northwestern India. The precipitation for 16.2% of the MPZ showed the strongest positive anomaly in mid-February and late March, located in Sri Lanka, eastern Thailand, Laos, Cambodia and Vietnam. The precipitation in other regions was slightly below the average after early January. Southern Asia, southern Thailand and central Vietnam were experiencing drought conditions in late January. According to the spatial distribution temperature profiles, the temperature for 45.3% of the MPZ (Nepal, northwestern India and central Myanmar) gradually rose in February and reached the highest values in mid-March. 1.9% of the area, which included Punjab and Haryana, experienced temperatures that were up to 8ºC higher than the 15 YA starting from mid-March. It caused terminal heat stress in wheat in these two states. In contrast, on 17.4% of the MPZ (Thailand, Laos, Cambodia and northern Vietnam) temperatures dropped in late February and early April. The temperature in other regions fluctuated around the average after January.
The BIOMASS departure map reveals that the potential biomass in Thailand, southern Cambodia and southern Vietnam was 20% higher than the average level, while the potential biomass in southern and eastern India, Nepal, Bangladesh and Myanmar was estimated to be below average. The Maximum VCI map shows that the index in northern, western and southern India and other scattered areas was higher than 1.0. The VHI Minimum map shows severe drought happened in northern India, central India and central Myanmar. CALF map indicates that most of the regions were planted except for western and central India and central Myanmar.
In summary, the crop conditions of winter crops in this MPZ were generally favorable, apart from the extremely high temperatures that affected the northwest of India starting from mid-March. Since this regions mainly grows irrigated crops, and irrigation mitigated the impact of high air temperature, which shorten the duration of grouting period and caused very limited influence on crop condition.
Figure 2.4 South And Southeast MPZ: Agroclimatic and agronomic indicators, January - April 2022.
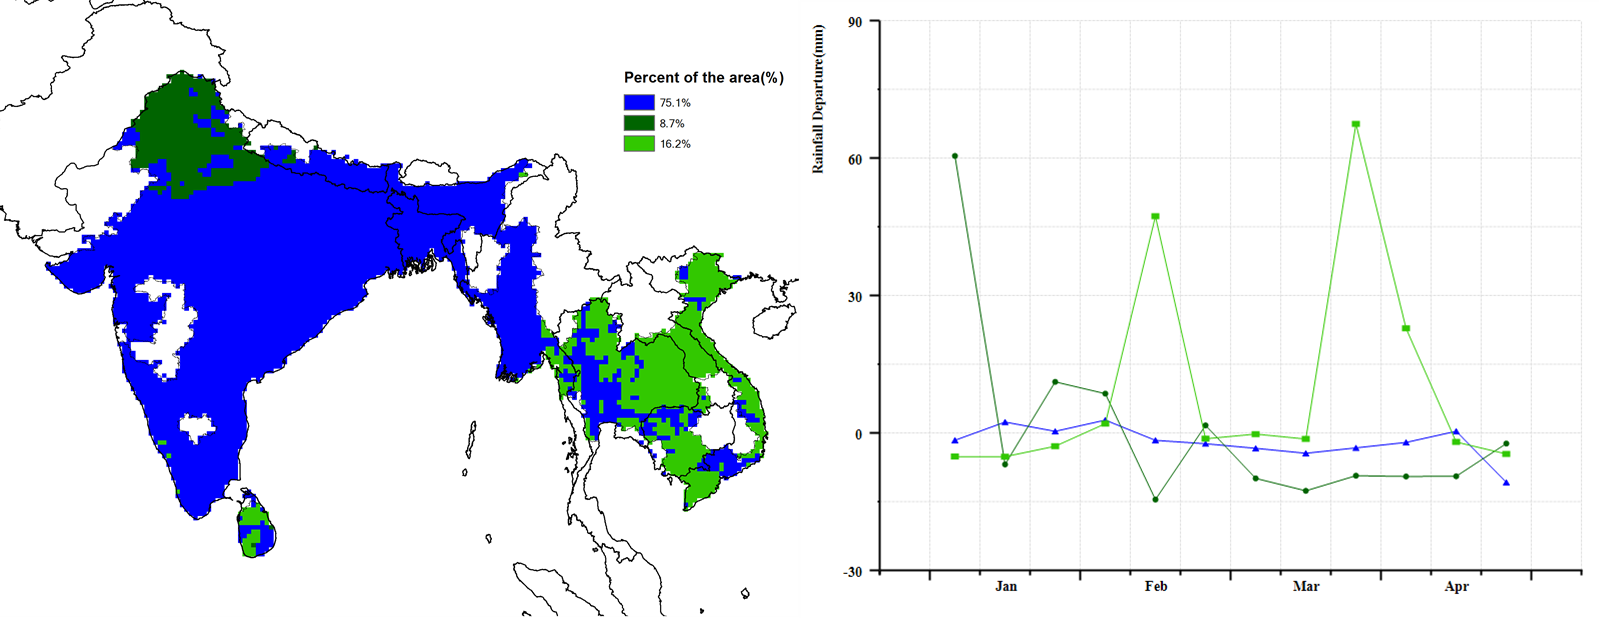
a.Spatial distribution of rainfall profiles b.Profiles of rainfall departure from average (mm)
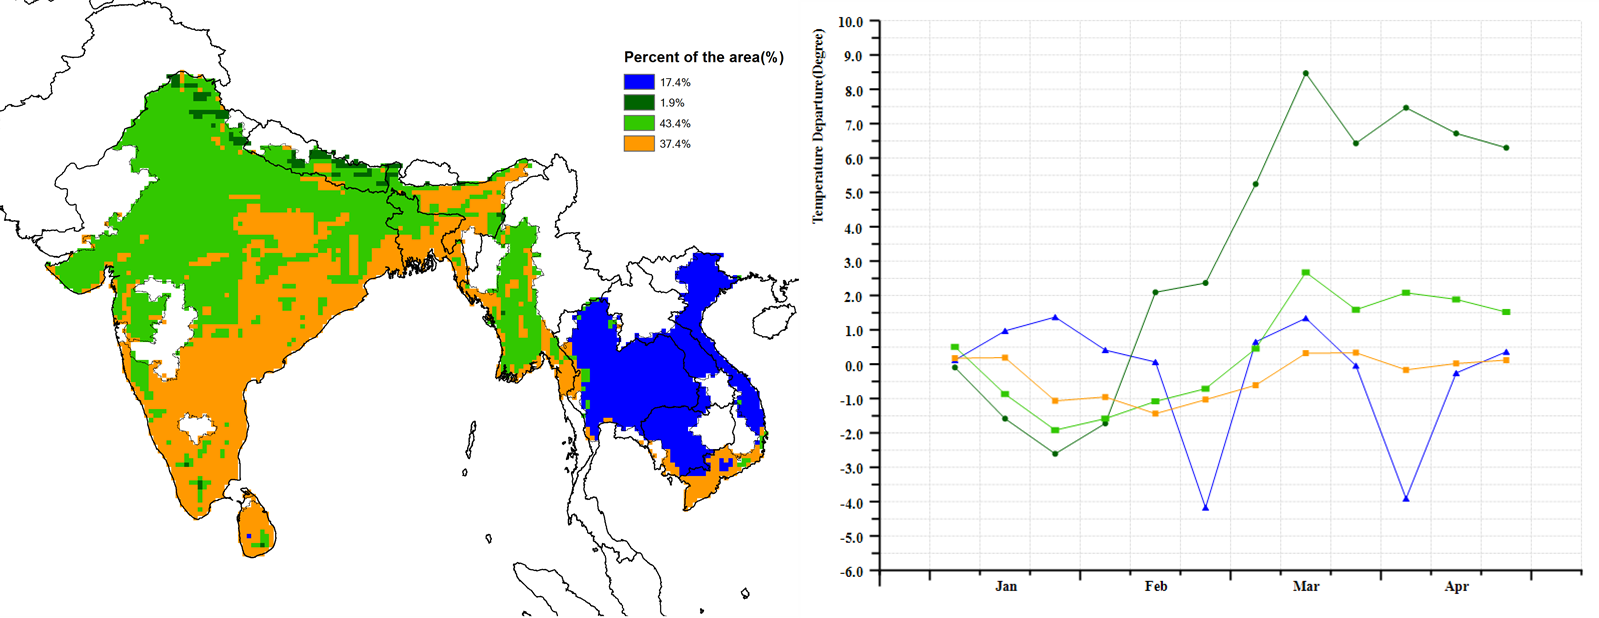
c.Spatial distribution of temperature profiles d.Profiles of temperature departure from average (mm)
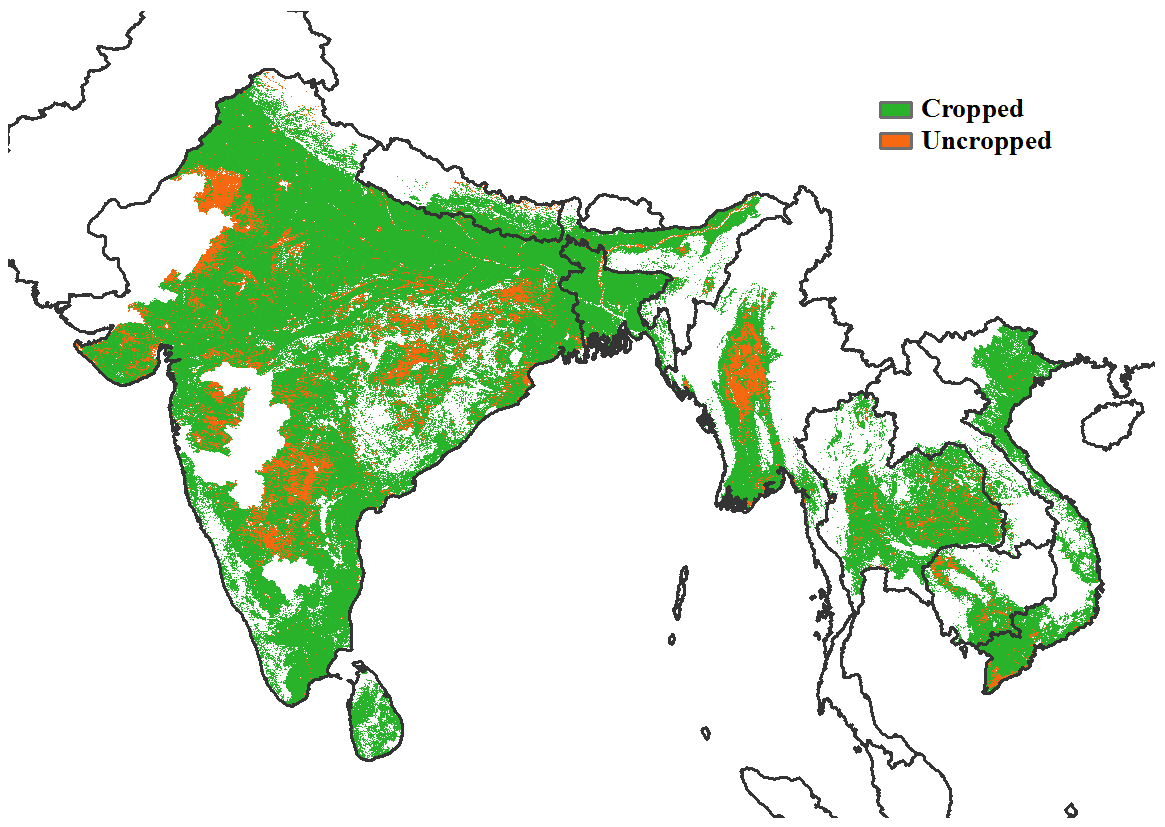
e.Cropped and uncropped arable land
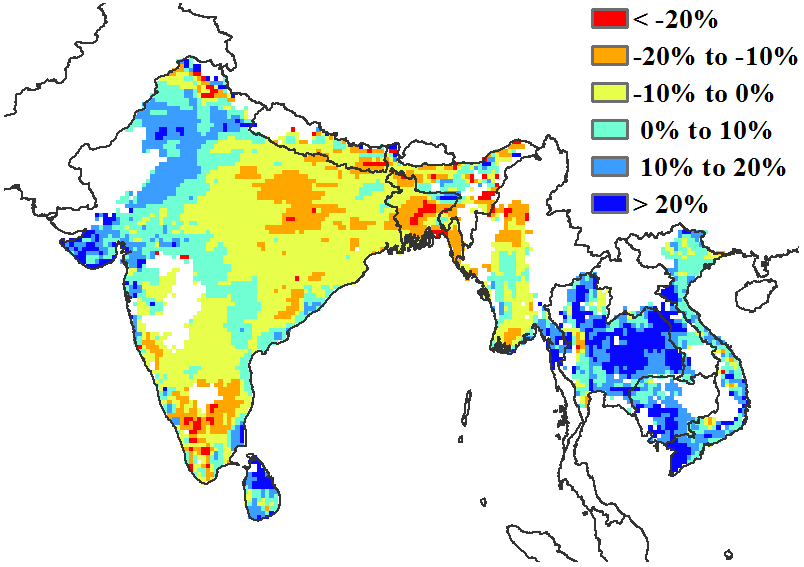
f.Potential biomass departure from 15YA
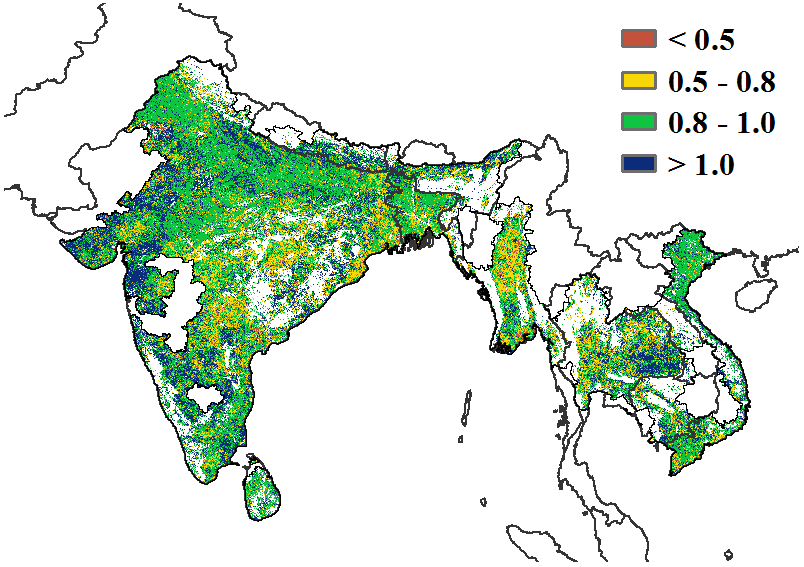
g.Maximum VCI
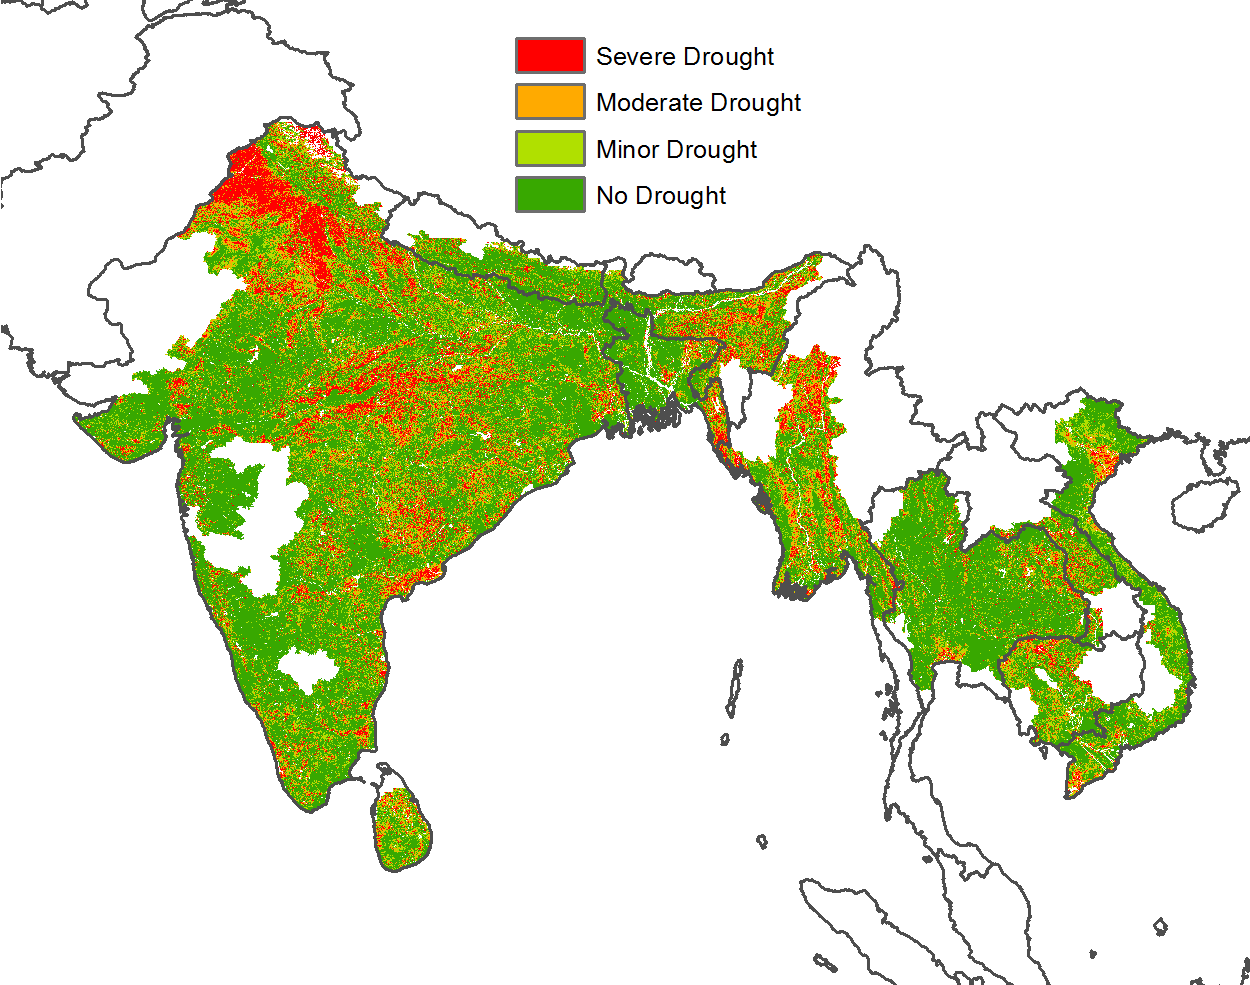
h.VHI Minimum