 English
 中文
中文
Bulletin
wall bulletinMenu
- Overview
- Country analysis
- Afghanistan
- Angola
- Argentina
- Australia
- Bangladesh
- Belarus
- Brazil
- Canada
- Germany
- Egypt
- Ethiopia
- France
- United Kingdom
- Hungary
- Indonesia
- India
- Iran
- Italy
- Kazakhstan
- Kenya
- Cambodia
- Sri Lanka
- Morocco
- Mexico
- Myanmar
- Mongolia
- Mozambique
- Nigeria
- Pakistan
- Philippines
- Poland
- Romania
- Russia
- Thailand
- Turkey
- Ukraine
- United States
- Uzbekistan
- Viet Nam
- South Africa
- Zambia
- Kyrgyzstan
- Algeria
Authors: 超级管理员 | Edit: zhuliang
The monitoring period from July to October is the main time for harvest in Russia. Winter crops are harvested from late June to late July and spring crops are harvested from mid-August to late September. They had reached the peak of their growth in July. The sowing of winter crops begins in September. Therefore, weather conditions during the monitoring period are important for both spring and winter crops.
During the analyzed period, rainfall was mainly above the 15YA, sometimes reaching the 15 year maximum, except for August and the beginning of September, when precipitation was below 15YA and the level of the previous year.
Temperatures in Russia from July to August were mainly close to the 15YA and last year's value.
According to the national CropWatch data, NDVI during the monitoring period was mainly below both the 5YA and the level of the previous year, except for July when it was close to these levels.
According to VHIn data category “no drought” prevailed during the analyzed period followed by the category “minor drought” compared to the 5YA. Their combined share was more than 85%. Among NDVI anomaly categories, “average” had prevailed with a proportion of about 60%.
Сrop conditions with VCIx above 0.8 are observed in Central and Black soil region. VCIx in South and North Caucasus regions ranges from <0.5 to 0.8. Spring crop producing regions (Volga, Urals, Siberia) showed VCIx ranging from 0.5 to 1. NDVI departure was mainly negative or close to 0. Only 9.8% of the territory (mainly located in Middle Volga region) showed clear positive NDVI departure.
In Middle Volga the crop yield is expected to be above or at the level of the previous year. In South and North Caucasus regions the yield of winter crops is likely to be lower than in the previous year. In Central and Black soil regions the yield of winter crops should be close to the 5YA. In spring crop producing regions the yield of spring crops is expected to be close to the 5YA or slightly below it.
Regional analysis
More spatial detail is provided below for nine main agro-ecological zones: South Caucasus (171), North Caucasus (169), Central Russia (164), Central black soils area (165), Middle Volga (168), Ural and western Volga (173), Western Siberia (174), Middle Siberia (167), and Eastern Siberia (166).
South Caucasus
Rainfall was 30% below the 15YA. Temperature and RADPAR were above the 15YA by 0.4°C and 2%, respectively. BIOMSS showed a negative deviation of 11% relative to the 15YA. The CALF was similar to the 5YA. Cropping intensity was by 19% above the 5YA. The VCIx was 0.75. Crop production index was 1.0 meaning that crop production situation was normal.
NDVI was mainly below the 5YA. Only in October it reached the level of the previous year. Judging by the index values, the 2021/2022 winter wheat harvest was lower than last year and 5YA as well as the harvest of summer crops.
North Caucasus
Rainfall was above the 15YA by 3% and temperature was above by 0.7°C. RADPAR decreased by 4% relative to the 15YA, and BIOMSS increased by 5% relative to the 15YA. CALF increased by 7% relative to the 5YA. Cropping intensity was by 16% above the 5YA. The VCIx was 0.79. Crop production index was 1.1.
During the monitoring period, NDVI was mainly below the 5YA and the level of the previous year. At the beginning of September, it reached 5-year maximum and then dropped back below the level of the previous year. It is likely that summer crop yield was lower than last year, and the sowing and status of 2022/2023 winter crop at the end of analyzed period was worse than in the previous year.
Central Russia
Rainfall was down by 3% relative to the 15YA. Temperature increased by 0.7°C relative to the 15YA. RADPAR was similar to the 15YA. BIOMSS decreased by 1% relative to the 15YA. CALF was equal to the 5YA. Cropping intensity was 4% below the 5YA. VCIx was 0.96. Crop production index was 1.2.
In July, NDVI was close to the last year's average and the 5YA, then it dropped below the level of the previous year and stayed there till the end of the analyzed period. The yield of 2021/2022 winter crops should be close to last year values, and below average, while the yield of spring and summer crops should be below the 5YA. The sowing campaign of 2022/2023 winter crops is likely to be worse than normal.
Central black soils area
Rainfall and temperature were above the 15YA by 47% and by 0.3°C respectively. RADPAR decreased by 8% relative to the 15YA. BIOMSS increased by 25% relative to the 15YA. The CALF and Cropping intensity were similar to the 5YA. VCIx was 0.93. Crop production index was 1.1.
From July through mid-August, the NDVI was close to the 5YA, till October when it first reached the 5-year maximum and then dropped below the level of the previous year. The yield of winter and spring crops is expected to be close to the last year and close to the 5YA. Summer crop yield should be also close to the average. The sowing campaign of 2022/2023 winter crop was delayed because of excessive rainfall.
Middle Volga
Rainfall, temperature and RADPAR increased by 10% relative to the 15YA, 1.0°C and 3% respectively. BIOMSS increased by 7% relative to the 15YA. CALF increased by 5% relative to the 5YA. Cropping intensity was 3% below the 5YA. The VCIx was 0.96. Crop production index was 1.3.
Until the middle of August, NDVI was close to the 5YA. Then it dropped to the level of the previous year until October when it decreased below this level. The yield of winter, spring, and summer crop is expected to be close to the last year and 5YA.
Ural and western Volga
In the Ural and western Volga, rainfall was down by 20% relative to the 15YA, while temperature increased by 0.9°C. RADPAR increased by 13% relative to the 15YA. Biomass decreased by 10% relative to the 15YA. CALF increased by 1% relative to the 5YA. Cropping intensity was by 1% below the 5YA. VCI was 0.92. Crop production index was 1.1.
Throughout the monitoring period, NDVI was below the 5YA and the last year's value. At the end of October, NDVI was equal to the 5YA. The yield of winter, spring, and summer crops is expected to be below the last year and the 5YA. The 2022/2023 sowing campaign is likely to be close to normal.
Western Siberia
In Western Siberia, rainfall increased by 15% over the 15YA. Temperature was down by 0.2°C relative to the 15YA. RADPAR and BIOMSS increased relative to the 15YA by 4% and 10% respectively. CALF was down by 2% relative to the 5YA. Cropping intensity was 1% below the 5YA. The VCIx was 0.87. Crop production index was 1.0.
The NDVI in Western Siberia was below last year's value and the 5YA. There are very few winter crops in this region. According to the NDVI graph, the yield of spring and summer crops is expected to be slightly below the 5YA and below the level of the previous year.
Middle Siberia
In Middle Siberia, rainfall decreased by 2% and temperatures decreased by 0.6°C relative to the 15YA. RADPAR increased by 2% while BIOMSS decreased by 1% relative to the 15YA. CALF decreased by 4% relative to the 5YA. Cropping intensity was 4% above the 5YA. VCIx was 0.89. Crop production index was 1.1.
In Middle Siberia, NDVI from July to August was at the level of the previous year and the 5YA, and from September to October was below these two levels. According to the charts, the yield of spring, and summer crops is expected to be close to the 5YA and the level of the previous year.
Eastern Siberia
In Eastern Siberia, rainfall increased by 4% compared to the 15YA, while temperature increased by 0.4°C. RADPAR and BIOMSS also increased relative to the 15YA by 3% and by 7% respectively. The CALF was similar to the 5YA. Cropping intensity was 4% below the 5YA. The VCIx was 0.96. Crop production index was 1.2.
NDVI was close to the 5YA and the last year's value. According to the graphs, the spring, and summer crops yield is expected to be close to the 5YA.
Figure 3.39 Russia's crop condition, July - October 2022
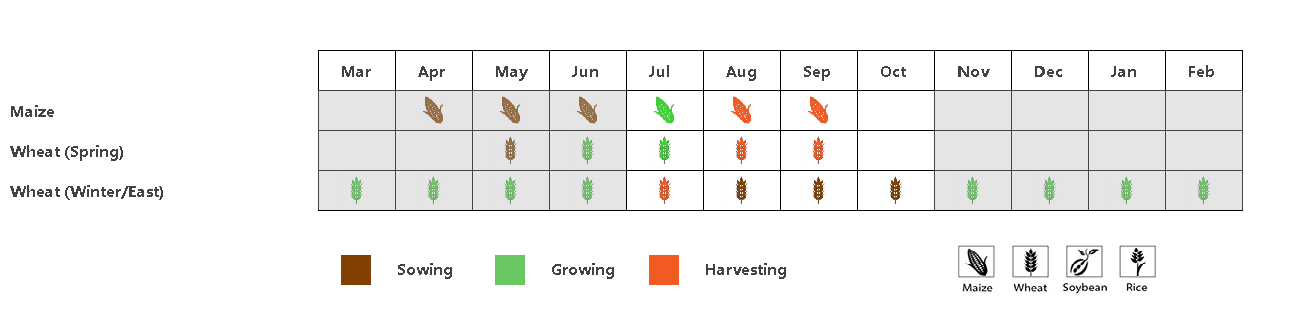
(a) Phenology of major crops
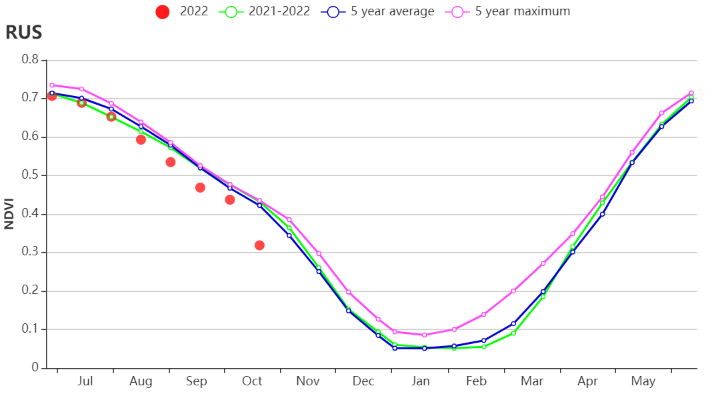
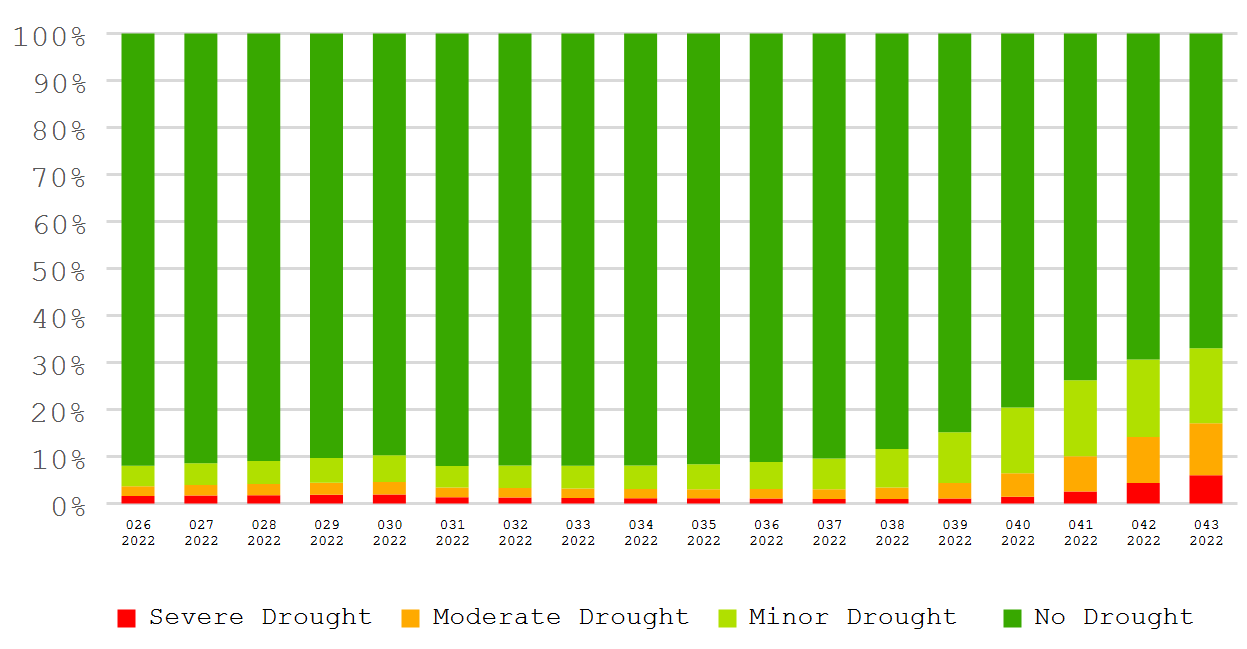
(b) Crop condition development graph based on NDVI (c) Proportion of VHIm categories compared with 5YA

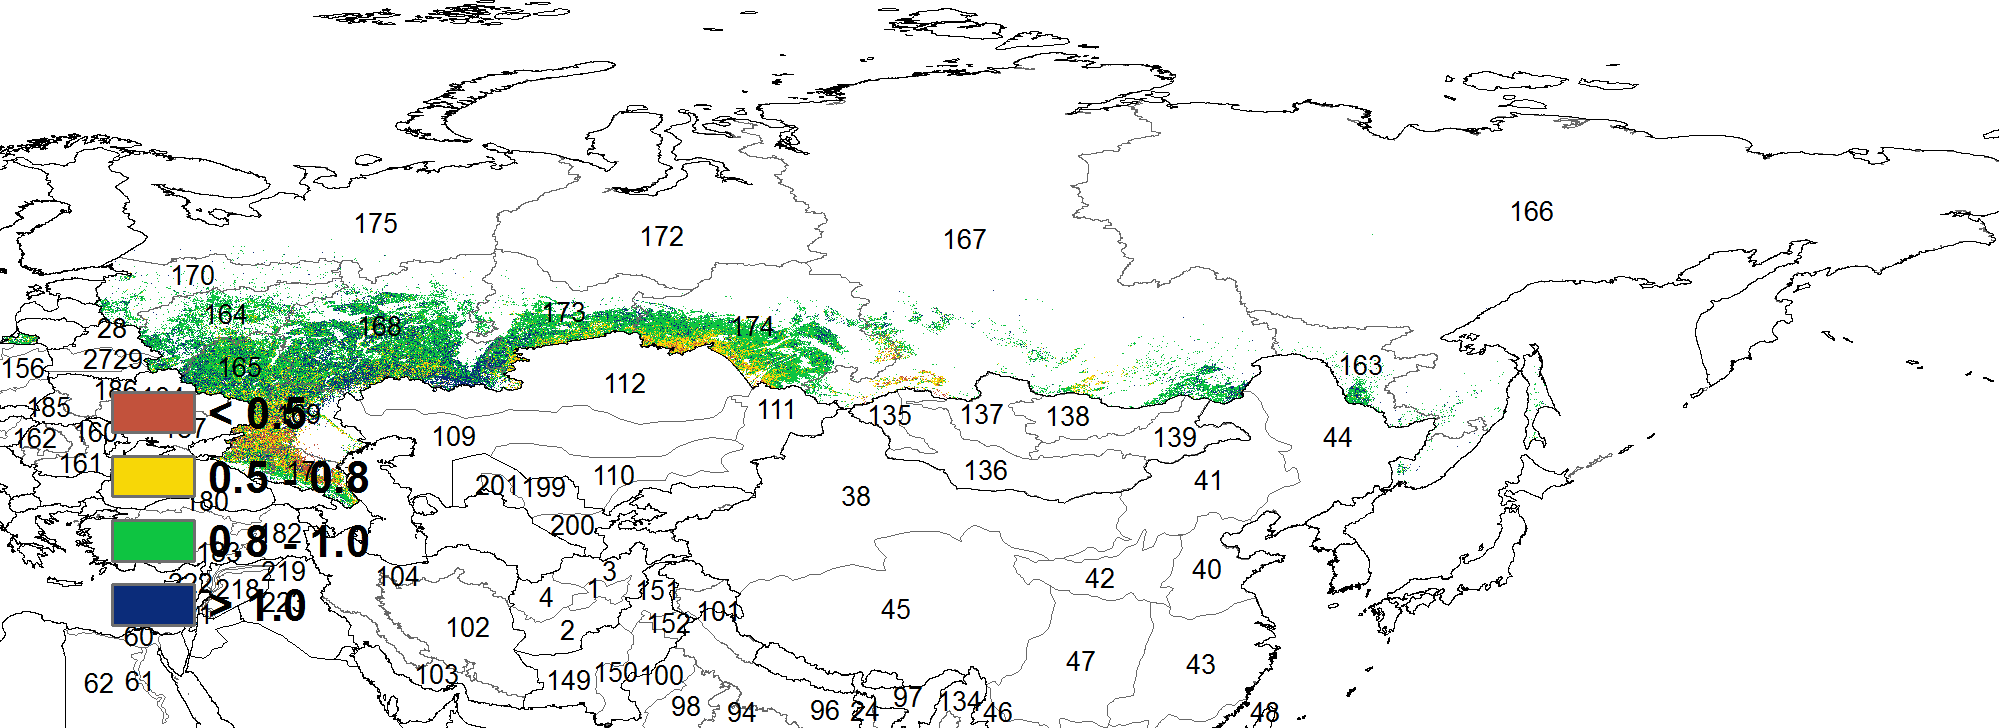
(d) Proportion of NDVI anomaly categories compared with 5YA (e) Maximum VCI
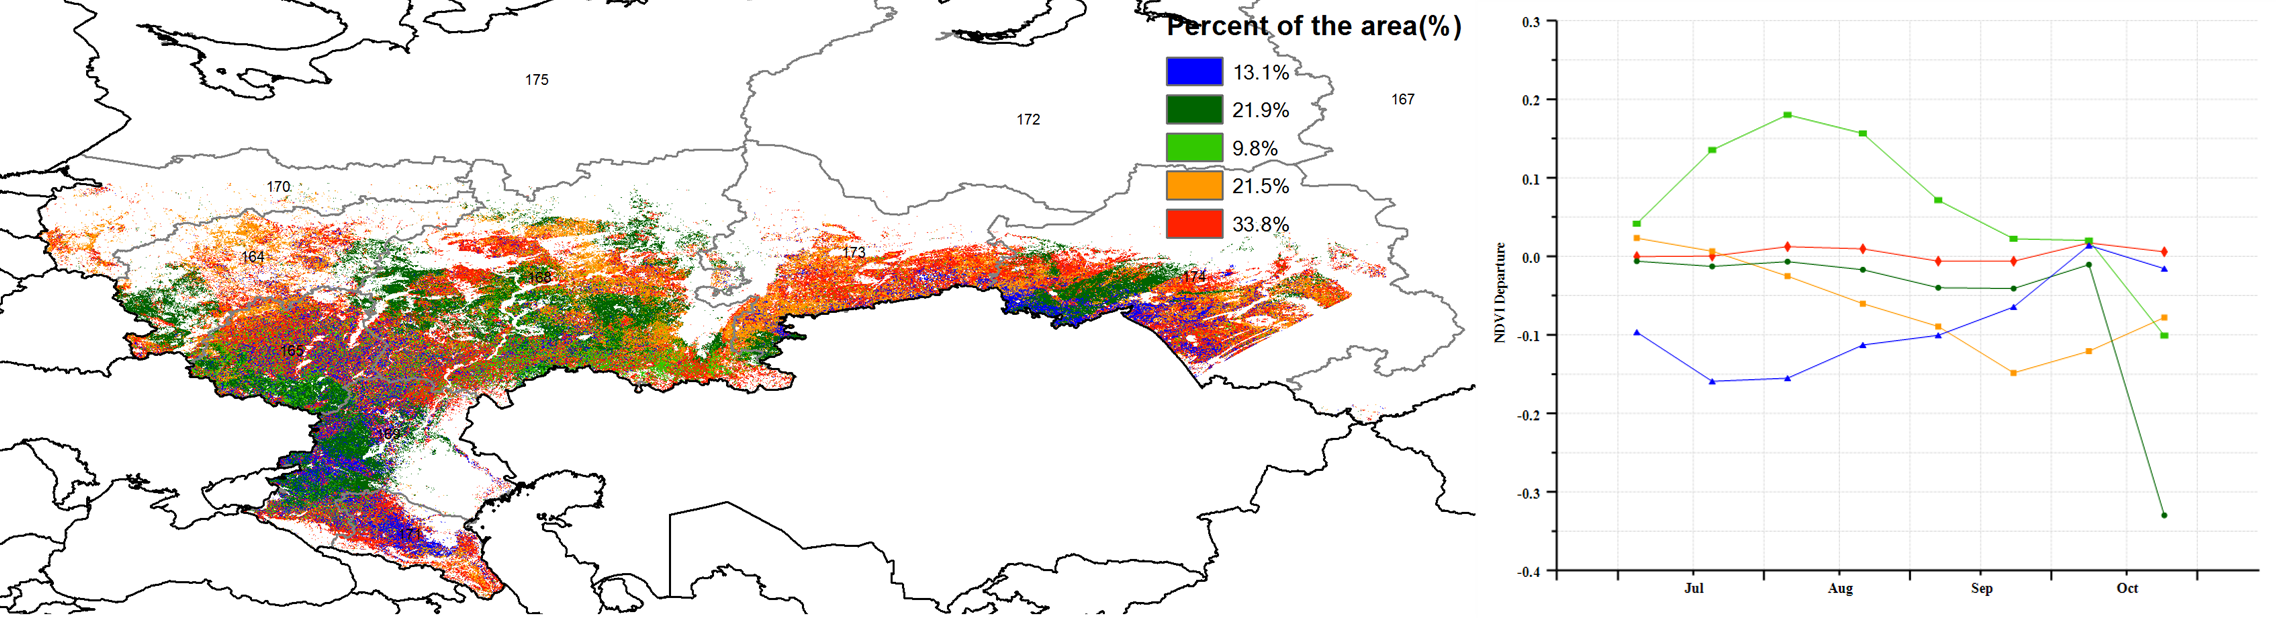
(f) Spatial NDVI patterns compared to 5YA (g) NDVI profiles

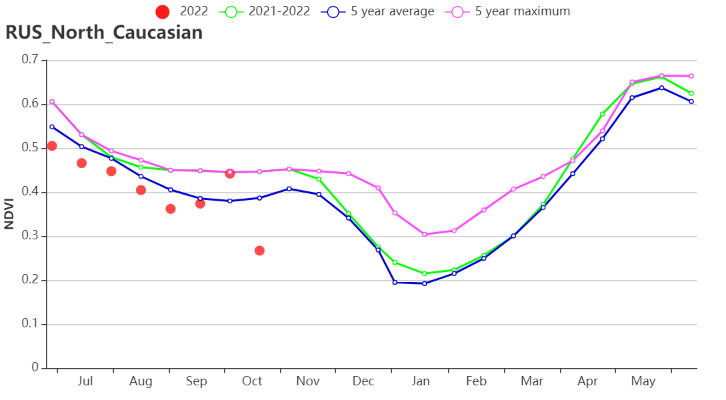
(h) Crop condition development graph based on NDVI (Southern Caucasus and Northern Caucasus)
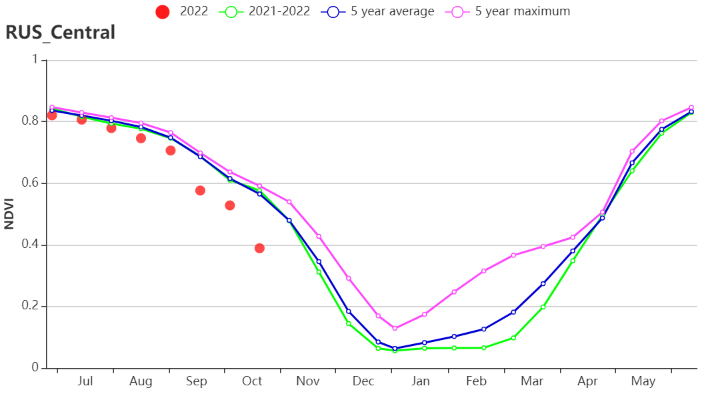

(i) Crop condition development graph based on NDVI (Central Russia and Central Chernozemic region)
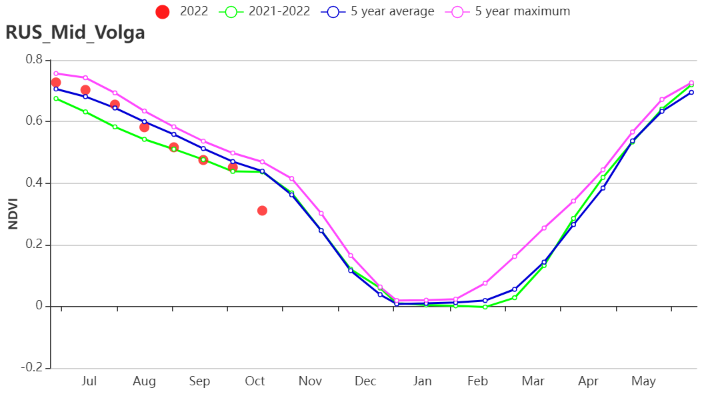
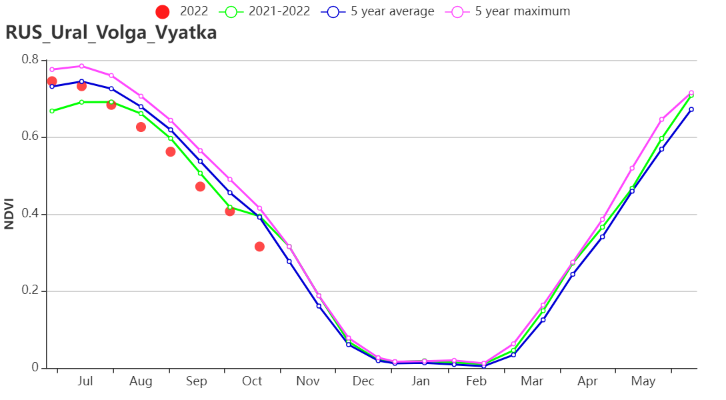
(j) Crop condition development graph based on NDVI (Middle Volga and Ural and western Volga region)

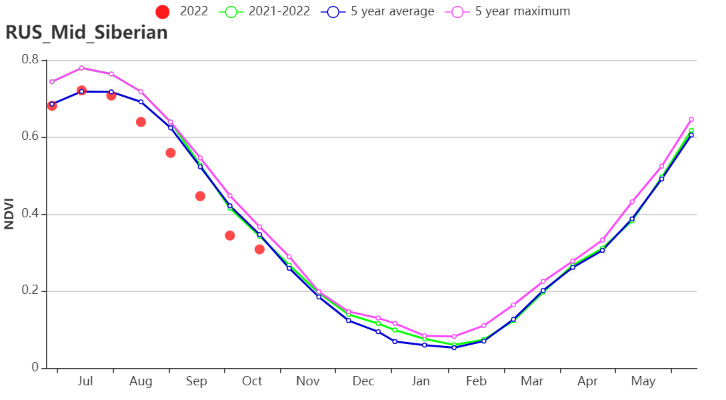
(k) Crop condition development graph based on NDVI (Eastern Siberia and Middle Siberia)
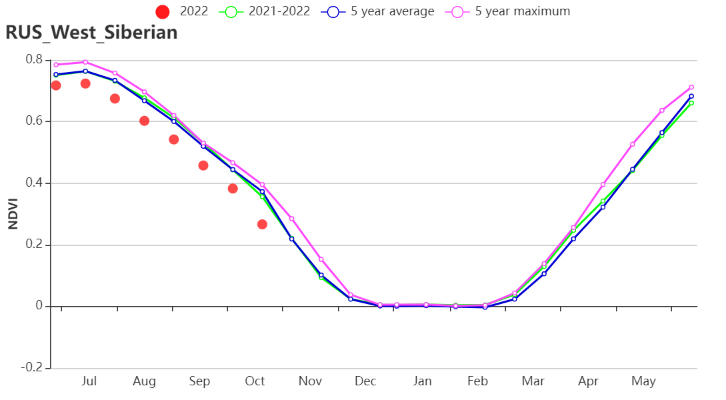
(l) Crop condition development graph based on NDVI (Western Siberia)

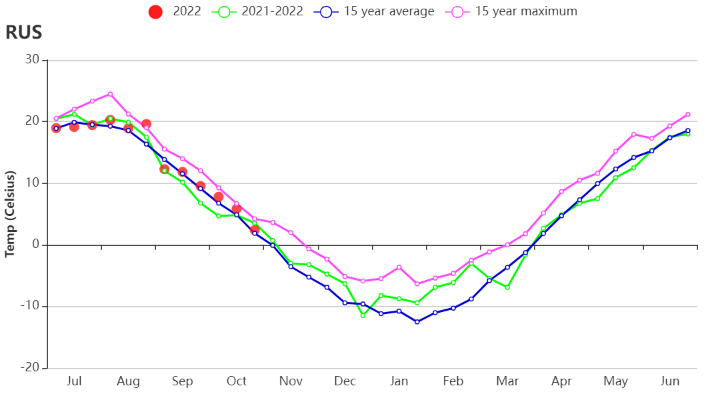
(m) Rainfall index (n) Temperature index
Table 3.70 Russia agroclimatic indicators by agro-ecological region, current season's values and departure from 15YA, July-October 2022
Region | RAIN | TEMP | RADPAR | BIOMSS | ||||
Current (mm) | Departure from 15YA(%) | Current (°C) | Departure from 15YA(°C) | Current (MJ/m2) | Departure from 15YA(%) | Current (gDM/m2) | Departure from 5YA (%) | |
Central Russia | 295 | -3 | 13.7 | 0.7 | 733 | 0 | 722 | -1 |
Central black soils area | 329 | 47 | 15.3 | 0.3 | 786 | -8 | 788 | 25 |
Eastern Siberia | 512 | 4 | 13.6 | 0.4 | 883 | 3 | 947 | 7 |
Middle Siberia | 282 | -2 | 8.9 | -0.6 | 935 | 2 | 637 | -1 |
Middle Volga | 289 | 10 | 14.6 | 1.0 | 831 | 3 | 717 | 7 |
Northern Caucasus | 204 | 3 | 19.6 | 0.7 | 1003 | -4 | 662 | 5 |
South Caucasus | 234 | -30 | 17.4 | 0.4 | 1099 | 2 | 660 | -11 |
Ural and western Volga region | 205 | -20 | 13.1 | 0.9 | 852 | 13 | 582 | -10 |
Western Siberia | 311 | 15 | 11.8 | -0.2 | 840 | 4 | 744 | 10 |
Table 3.71 Russia agronomic indicators by agro-ecological regions, current season's values and departure from 5YA, July-October 2022
Region | Cropped area | Cropping Intensity | Maximum VCI | ||
Current (%) | Departure from 5YA(%) | Current (%) | Departure from 5YA(%) | Current | |
Central Russia | 100 | 0 | 95 | -4 | 0.96 |
Central black soils area | 100 | 0 | 100 | 0 | 0.93 |
Eastern Siberia | 100 | 0 | 98 | -4 | 0.96 |
Middle Siberia | 95 | -4 | 105 | 4 | 0.89 |
Middle Volga | 99 | 5 | 96 | -3 | 0.96 |
Northern Caucasus | 89 | 7 | 121 | 16 | 0.79 |
South Caucasus | 77 | 0 | 123 | 19 | 0.75 |
Ural and western Volga region | 100 | 1 | 99 | -1 | 0.92 |
Western Siberia | 98 | -2 | 99 | -1 | 0.87 |