 English
 中文
中文
Bulletin
wall bulletinMenu
- Overview
- Country analysis
- Afghanistan
- Angola
- Argentina
- Australia
- Bangladesh
- Belarus
- Brazil
- Canada
- Germany
- Egypt
- Ethiopia
- France
- United Kingdom
- Hungary
- Indonesia
- India
- Iran
- Italy
- Kazakhstan
- Kenya
- Cambodia
- Sri Lanka
- Morocco
- Mexico
- Myanmar
- Mongolia
- Mozambique
- Nigeria
- Pakistan
- Philippines
- Poland
- Romania
- Russia
- Thailand
- Turkey
- Ukraine
- United States
- Uzbekistan
- Viet Nam
- South Africa
- Zambia
- Kyrgyzstan
- Syria
- Algeria
Authors: 超级管理员 | Edit: mazh
The harvest of wheat and barley ended in January. The sowing of the next wheat crop will start in May. In the current period, Australia had relatively dry weather with below average rainfall (RAIN, -13%), which will be unfavorable for the wheat planting in the next period. The temperature (TEMP +0) and radiation (RADPAR +1%) were both close to the average The dry weather led to below-average biomass accumulation potential (-4%). Additionally, CALF increased by 15% compared with the recent five-year average, while the maximum VCI was 0.86.
In the four main wheat production states, only South Australia with above-average rainfall (+6%) had positive biomass estimates (+3%). The other 3 states all received below-average rainfall (New South Wales, -18%; Victoria, -7%; Western Australia, -4%), and biomass by -7%, -3%, -4%, respectively.
The NDVI profile was generally close to the average levels observed over the past 5 years, except in later February and March.
Regional analysis
This analysis adopts five agro-ecological zones (AEZs) for Australia, namely the Arid and Semi-arid Zone (marked as 18 in NDVI clustering map), Southeastern Wheat Zone (19), Subhumid Subtropical Zone (20), Southwestern Wheat Zone (21), Wet Temperate and Subtropical Zone (22). The Arid and Semi-arid Zone, in which hardly any crop production takes place, was not analyzed.
Both the Southeastern wheat area and Southwestern wheat area had similar agro-climatic conditions, which were characterized by below-average rainfall (-11%, -17%), slightly cooler temperature (-0.2°C, -0.7°C), and more or less average radiation (-0%, +3%). The below average rainfall caused a low biomass accumulation potential (-3%, -7%). The CALFs in these two AEZs were improved by 28% and 30%, respectively, with maximum VCI of 0.9 and 0.88.
The Subhumid subtropical zone recorded largely below-average rainfall (-33%), while the temperature was slightly above (+0.4°C). The radiation was slightly above average (+2%). Consequently, the biomass was 12% lower than 15-year average. The CALF was decreased by 5%, while maximum VCI was 0.72.
The Wet temperate and subtropical zone had slightly below average rainfall (-9%), slightly above average temperature (+0.2°C) and radiation (+1%). The biomass was average. The CALF was 99%, and the maximum VCI was 0.82.
Overall, the agro-climatic indicators in the reporting period, especially rainfall, predict moderate prospects for the coming wheat planting season in Australia.
Figure 3.5 Australia crop condition, January - April 2023

(a). Phenology of major crops
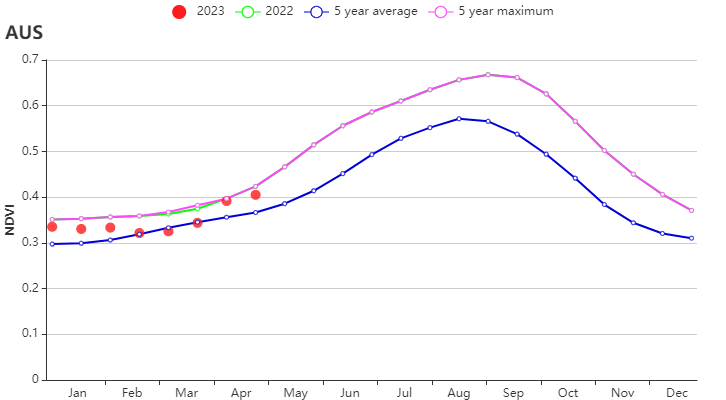

(b) Crop condition development graph based on NDVI (c) Maximum VCI
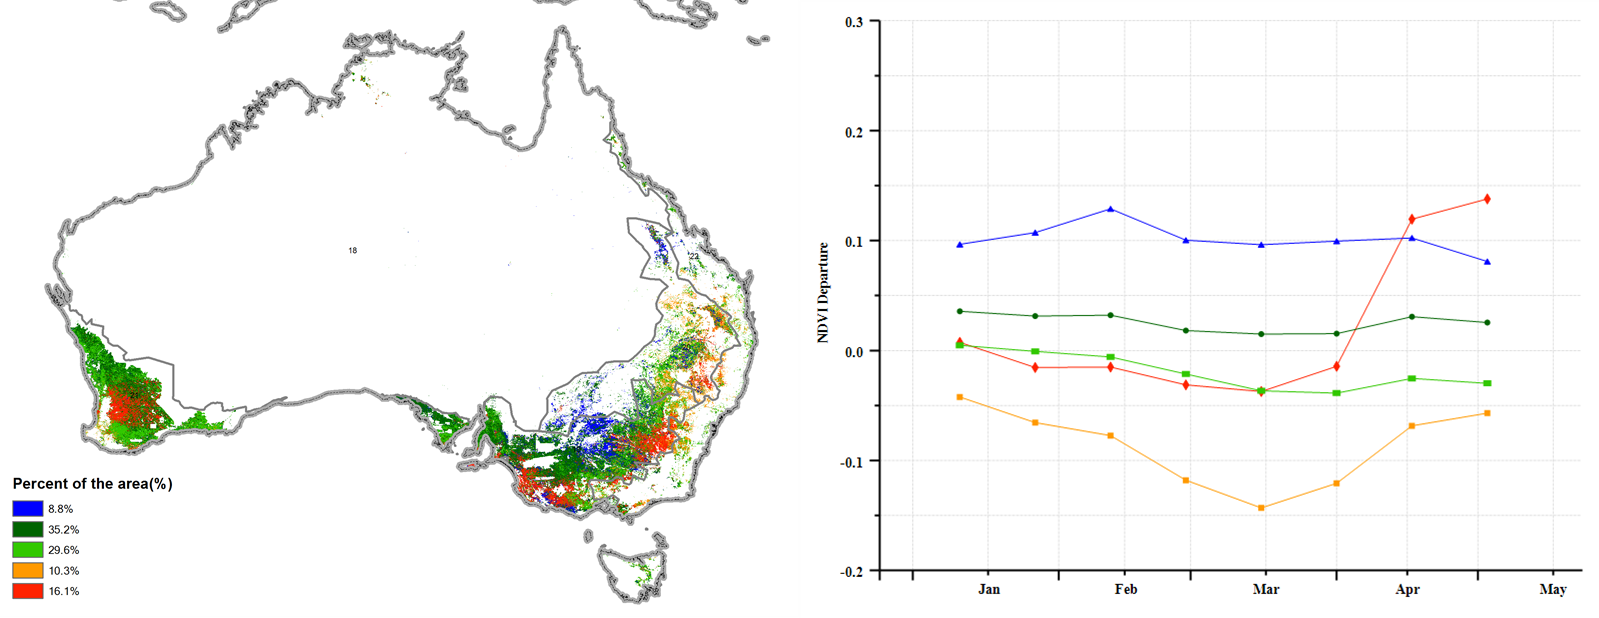
(d) Spatial NDVI patterns compared to 5YA (e) NDVI profiles
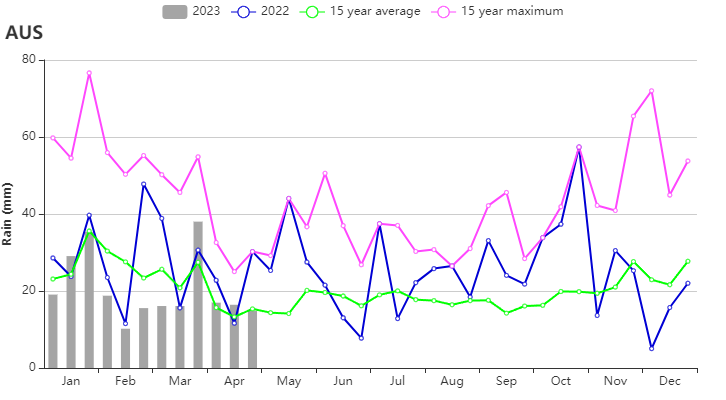
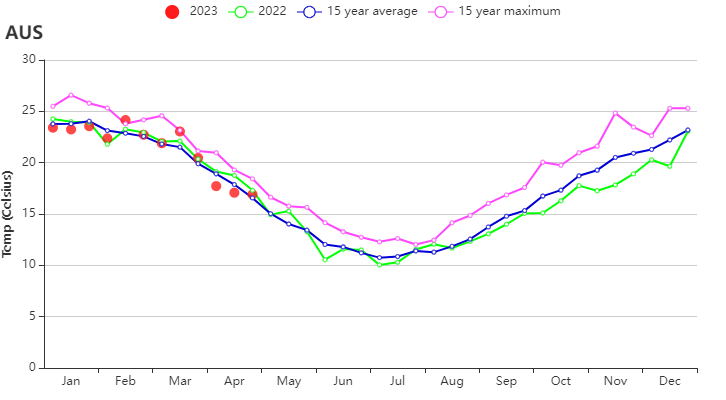
(f) Time series rainfall profile (left) and temperature profile (right))

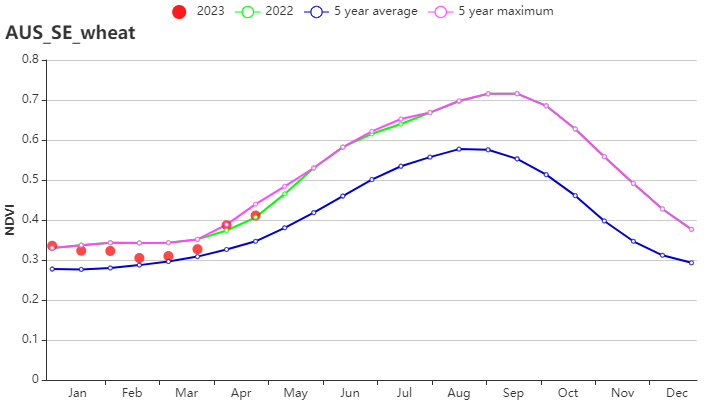
(g) Crop condition development graph based on NDVI (Arid and semiarid zone (left) and Southeastern wheat area (right))

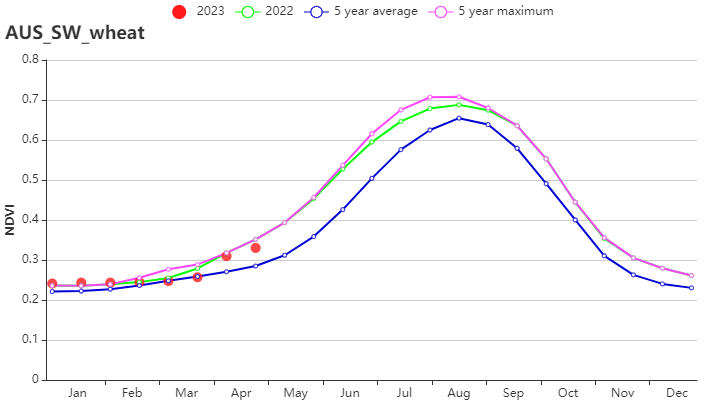
(h) Crop condition development graph based on NDVI (Subhumid subtropical zone (left) and Southwestern wheat area (right))
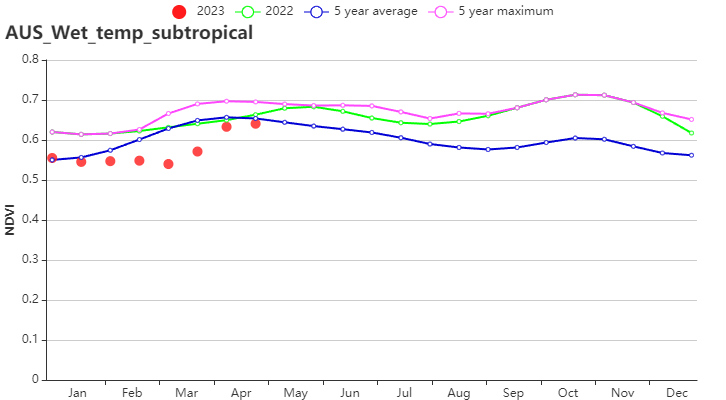
(i) Crop condition development graph based on NDVI (Wet temperate and subtropical zone)
| Table 3.5.Australia’s agroclimatic indicators by sub-national regions, current season's values and departure from 15YA, Janurary - April 2023 | ||||||||
| Region | RAIN | TEMP | RADPAR | BIOMSS | ||||
| Current (mm) | Departure from 15YA (%) | Current (°C) | Departure from 15YA (°C) | Current (MJ/m2) | Departure from 15YA (%) | Current (gDM/m2) | Departure from 15YA (%) | |
| Arid and semiarid zone | 767 | 4 | 25.9 | -0.1 | 1264 | 2 | 1086 | 8 |
| Southeastern wheat area | 148 | -11 | 20.6 | -0.2 | 1198 | 0 | 628 | -3 |
| Subhumid subtropical zone | 167 | -33 | 23.9 | 0.4 | 1276 | 2 | 692 | -12 |
| Southwestern wheat area | 88 | -17 | 20.4 | -0.7 | 1286 | 3 | 541 | -7 |
| Wet temperate and subtropical zone | 380 | -9 | 19.7 | 0.2 | 1144 | 1 | 859 | 0 |
| Table 3.6. Australia’s agronomic indicators by sub-national regions, current season’s values and departure from 5YA, Janurary - April 2023 | |||
| Region | CALF | Maximum VCI | |
| Current (%) | Departure from 5YA (%) | Current | |
| Arid and semiarid zone | 70 | 3 | 0.87 |
| Southeastern wheat area | 41 | 28 | 0.90 |
| Subhumid subtropical zone | 42 | -5 | 0.72 |
| Southwestern wheat area | 20 | 30 | 0.88 |
| Wet temperate and subtropical zone | 99 | 4 | 0.82 |