 English
 中文
中文
Bulletin
wall bulletinMenu
- Overview
- Country analysis
- Afghanistan
- Angola
- Argentina
- Australia
- Bangladesh
- Belarus
- Brazil
- Canada
- Germany
- Egypt
- Ethiopia
- France
- United Kingdom
- Hungary
- Indonesia
- India
- Iran
- Italy
- Kazakhstan
- Kenya
- Cambodia
- Sri Lanka
- Morocco
- Mexico
- Myanmar
- Mongolia
- Mozambique
- Nigeria
- Pakistan
- Philippines
- Poland
- Romania
- Russia
- Thailand
- Turkey
- Ukraine
- United States
- Uzbekistan
- Viet Nam
- South Africa
- Zambia
- Algeria
- Kyrgyzstan
- Lebanon
- Syria
Authors: deabelle,Jingkangjian | Edit: tianfuyou
ARG (Argentina)
The reporting period covers the main development period of summer crops: soybean, maize and rice. Additionally, the harvest of rice, early maize and early soybean occured in this period. CropWatch subdivides Argentina into eight agro-ecological zones (AEZ) based on cropping systems, climatic zones, and topography; they are identified by numbers on the NDVI departure cluster map. During this monitoring period, most crops were grown in the following four AEZs: Chaco (11), Mesopotamia (12), Humid Pampas (13), and Subtropical Highlands (17). The other agro-ecological zones were less relevant for this period. Wheat is planted in Center, South and East Pampas, South Mesopotamia, Chaco, and East Subtropical Highlands. Maize and soybean are planted in all the AEZs, while rice is planted in North Mesopotamia and East Chaco. Crop conditions in Argentina showed average and above average conditions in several of the indices analyzed, including VCIx, BIOMSS, NDVI and rainfall.
Good conditions in Argentina are reflected in the increases in BIOMSS (+11%), high values of VCIx (0.90) and a slightly greater than average CPI (1.03). This can be explained by positive anomalies in rainfall (+28%) and almost no anomaly in temperature (+0.4°C). Nevertheless, RADPAR showed a reduction of -6%.
NDVI time series showed for the whole country and for each of the AEZs, a strong negative anomaly at the beginning of February. This can be related to a strong negative anomaly in precipitation observed at the end of January and positive anomalies in temperature observed at the beginning of February. The combination of these factors could have caused water stress in the middle of the summer season. Nevertheless, the duration of these conditions was short, as precipitation only showed negative anomalies again at the end of February. Probably because of this, several agronomic indices were not greatly affected, but grain filling could have been affected.
The spatial distribution of NDVI profiles determined five different patterns. As expected from national level situation, several profiles showed NDVI reductions at the beginning of February. The orange profile showed positive anomalies during most of the reporting period, and was observed mostly in North East Pampas, as well as in South Pampas, East Chaco and North Mesopotamia. The dark green profile showed positive anomalies during January and negative anomalies since end March, and was observed in West and South Pampas and Subtropical Highlands. The blue profile showed almost no anomalies during most of the reporting period, with the exception of a strong negative anomaly at the beginning of February. It was mainly observed in South West Pampas, as well as in East Chaco and North and South Mesopotamia. Light green profile showed negative anomalies from January to the beginning of February and positive anomalies since March. It was observed mainly in West Pampas and also in Center Chaco and South Pampas. Finally, the red profile showed negative anomalies throughout the reporting period with its lowest value at the beginning of February. It was observed in South Pampas and West Chaco. The area of South Pampas with negative NDVI anomalies coincides with the observed uncropped area.
The maximum VCI map showed good conditions for most of the AEZs (values higher than 0.8), with the exception of the South Pampas, where quite low values (lower than 0.5) were observed. This is consistent with the mentioned uncropped areas and negative anomalies of NDVI observed there.
Agronomic indices showed some similarities and differences among the main AEZs. CALF was quite high in the four considered AEZs with no observed anomalies; VCIx showed maximum values for Mesopotamia (0.95), followed by Chaco (0.93), Humid Pampas (0.91) and Subtropical Highlands (0.90). CPI values were also the highest at Mesopotamia (1.10), followed by Chaco (1.04), Humid Pampas (1.03) and Subtropical Highlands (1.01). BIOMSS showed highest values for Mesopotamia (+18%), followed by Humid Pampas (+11%), Chaco (+8%), and Subtropical Highlands (+7%). These indices partially reflect the observed rainfall, which showed highest positive anomalies in Mesopotamia (+51%), followed by Humid Pampas (38 %), Chaco (21 %), and Subtropical Highlands (+5%). Temperature showed the highest positive anomalies in Subtropical Highlands (1.3°C), followed by Chaco (0.6°C) and Mesopotamia and Humid Pampas (0.1°C). RADPAR showed quite similar and negative values in the four MPZ with departures from the 15YA not higher than 3%.
Overall, the above average CPI, higher VCIx and generally higher BIOMSS reflect favourable conditions for crop growth and development. In general, the NDVI is close to average but significantly better than the same period last year, indicating a trend towards higher yields across Argentina. However, there will be a slight yield reduction in the southern part of the humid Pampas region.
Figure 3.7 Argentina 's crop conditionJanuary - April 2024
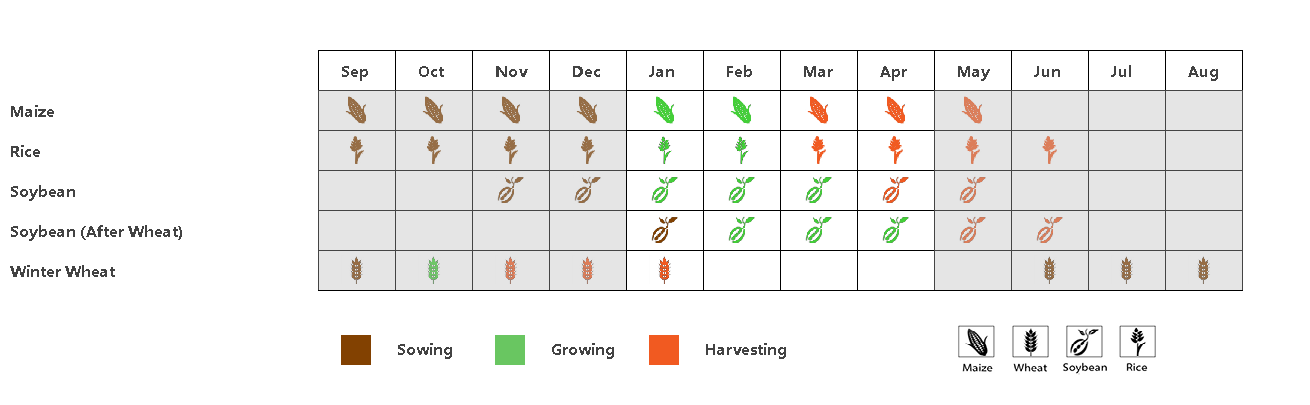
(a). Phenology of major crops

(b). Spatial distribution of NDVI profiles

(c). Maximum VCI

(d). Crop condition development graph based on NDVI (Argentina)

(e). Crop condition development graph based on NDVI (Humid Pampas)

(f). Crop condition development graph based on NDVI (Chaco)

(g). Crop condition development graph based on NDVI (Mesopotamia)

(h). Crop condition development graph based on NDVI (Subtropical Highlands)

(i). Time series rainfall profile (Argentina)

(j). Time series temperature profile (Argentina)

(k). Crop Production Index (CPI) time series chart (Argentina)
Table 3.5. Argentina’s agronomic indicators by sub‐national regions, current season's values and departure from 5YA, January – April 2024.
CALF | Maximum VCI | CPI | ||
Region | Current(%) | Departure from 5YA (%) | Current | Current |
Chaco | 100 | 0 | 0.93 | 1.04 |
Mesopotamia | 100 | 0 | 0.95 | 1.10 |
Humid Pampas | 99 | 0 | 0.91 | 1.03 |
Subtropical Highlands | 99 | 0 | 0.90 | 1.01 |
Table 3.6. Argentina’s agroclimatic indicators by sub‐national regions, current season's values and departure from 15YA, January – April 2024.
RAIN | TEMP | RADPAR | BIOMSS | |||||
Region | Current (mm) | Departure from 15YA (%) | Current (°C) | Departure from 15YA (°C) | Current (MJ/m2) | Departure from 15YA (%) | Current (gDM/m2) | Departure from 15YA (%) |
Chaco | 580 | 21 | 25.2 | 0.6 | 1062 | -7 | 1138 | 8 |
Mesopotamia | 759 | 51 | 23.4 | 0.1 | 1088 | -8 | 1238 | 18 |
Humid Pampas | 384 | 38 | 21.7 | 0.1 | 1156 | -5 | 906 | 11 |
Subtropical | 895 | 5 | 21.9 | 1.3 | 1027 | -6 | 1188 | 7 |