
Bulletin
wall bulletinMenu
- Overview
- Country analysis
- Afghanistan
- Angola
- Argentina
- Australia
- Bangladesh
- Belarus
- Brazil
- Canada
- Germany
- Egypt
- Ethiopia
- France
- United Kingdom
- Hungary
- Indonesia
- India
- Iran
- Italy
- Kazakhstan
- Kenya
- Cambodia
- Sri Lanka
- Morocco
- Mexico
- Myanmar
- Mongolia
- Mozambique
- Nigeria
- Pakistan
- Philippines
- Poland
- Romania
- Russia
- Thailand
- Turkey
- Ukraine
- United States
- Uzbekistan
- Viet Nam
- South Africa
- Zambia
- Algeria
- Kyrgyzstan
- Lebanon
- Syria
Authors: tianfuyou | Edit: tianfuyou
This monitoring period is the land preparation season for summer crops in Canada. A few winter crops are grown, such as wheat, barley and oilseeds. Most of them are grown in the Saint Lawrence Basin (Ontario and Quebec). In general, the NDVI profiles indicated a good start of the growing season.
In Canada, almost all fields are rain-fed and only 5% of arable land is irrigated, making rainfall a critical factor in crop growth. According to the CropWatch Agroclimatic Indicators, average total rainfall was 278 mm and radiation was 480 MJ/m², 7% and 9% below the 15-year average, respectively. The average temperatures was -4.0°C, which is 1.8°C above the 15-year average. Estimated potential BIOMSS was 14% higher than the 15-year average.
The Cropped Arable Land Fraction (CALF) was at the average level of 19%. The VCIx is currently 0.85, indicating acceptable vegetation health. Overall, the agricultural situation in Canada from January to April 2024 is characterised average crop conditions.
Regional analysis
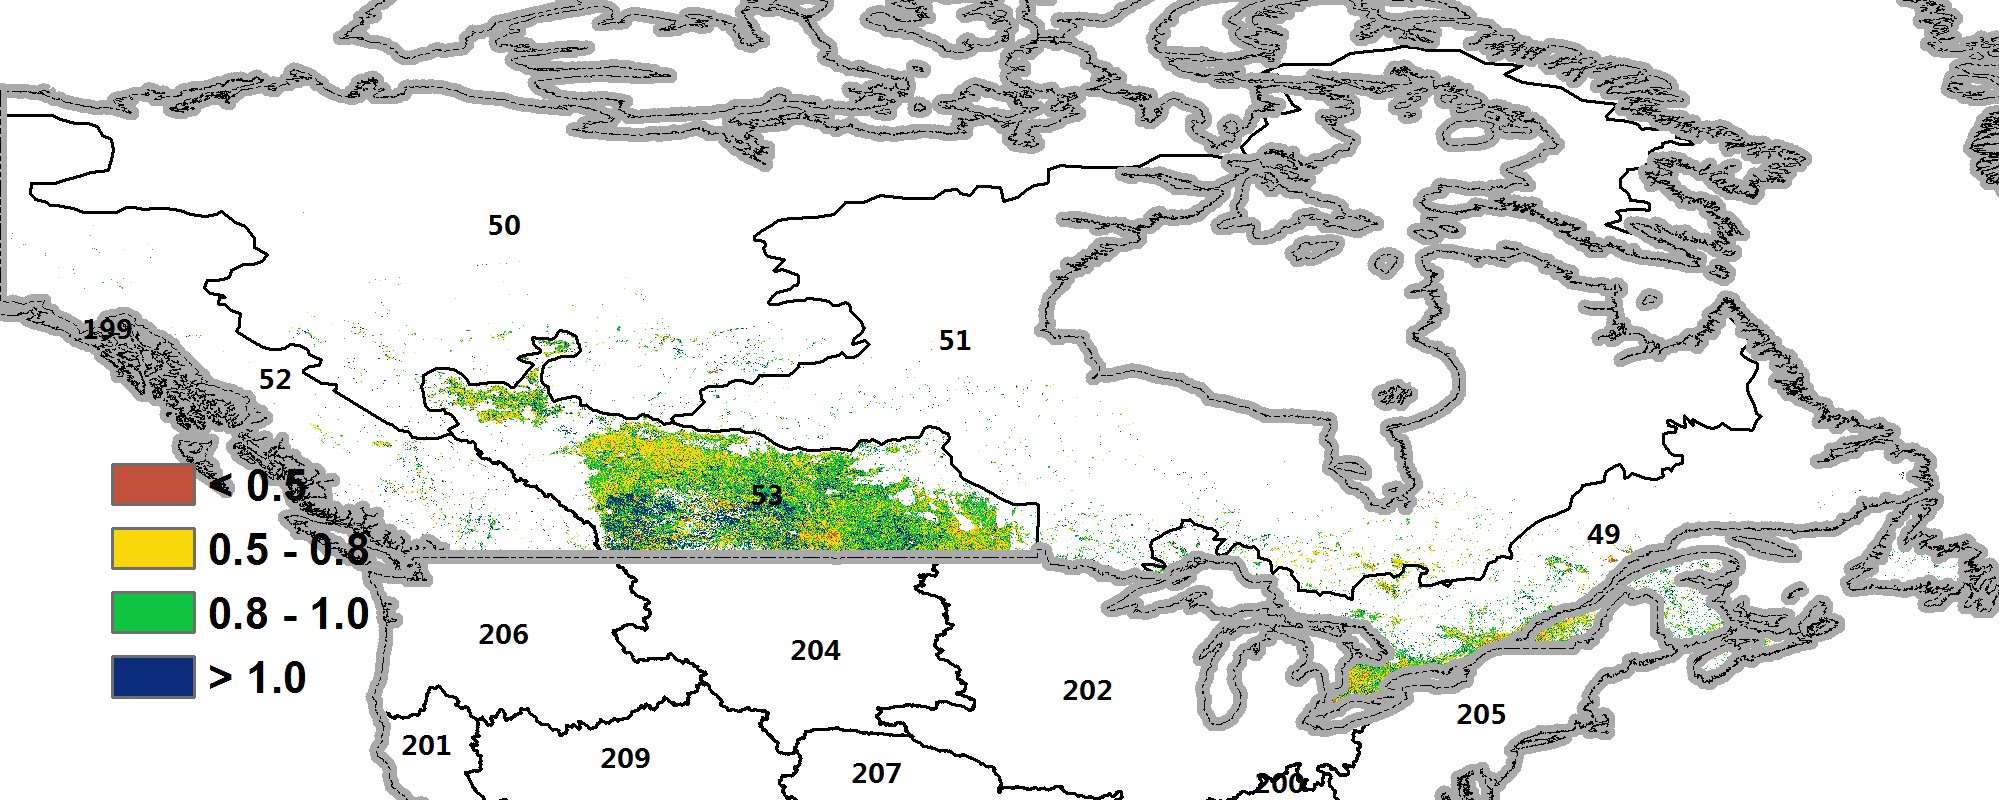
The Prairies (area identified as 53 in the NDVI clustering map) and Saint Lawrence basin (49, covering Ontario and Quebec) are the two major agricultural regions.
The Saint Lawrence Basin is the main production area for winter wheat in Canada. Most winter wheat is grown in southeastern Ontario, near Toronto and Ottawa. Precipitation and radiation were below the 15-year average (RAIN -6%; RADPAR -13%), and temperatures were well above average (TEMP +2.5℃). Despite the below-average trend in NDVI at the beginning of the season, crop condition recovered towards the end and the outlook for winter wheat production is favourable.
In the Prairies, the land preparation for summer crops started in April. Harldly any crops are grown during the winter months. The temperature was above average (TEMP +1.2°C), while rainfall and radiation were below the 15-year average (RAIN -9% and RADPAR -13% respectively). Conditions so far have been slighthly below average, but the weather during the main planting period in May will be important for the establishment of the summer crops.
Figure 3.12 Canada's crop condition January-April 2024

(a). Phenology of major crops
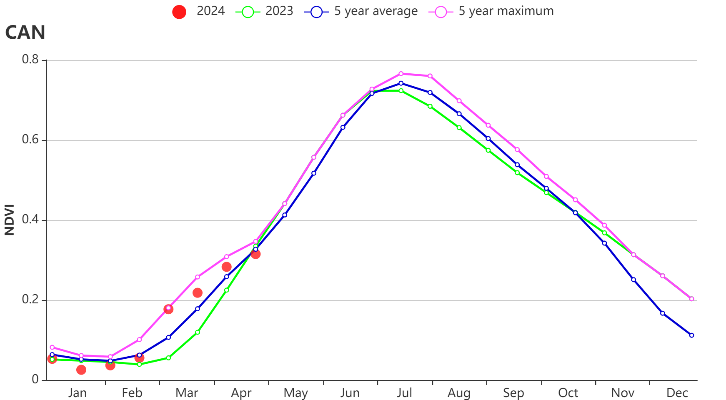
(b) Crop condition development graph based on NDVI (c) Maximum VCI

(d) Spatial NDVI patterns compared to 5YA (e) NDVI departure profiles
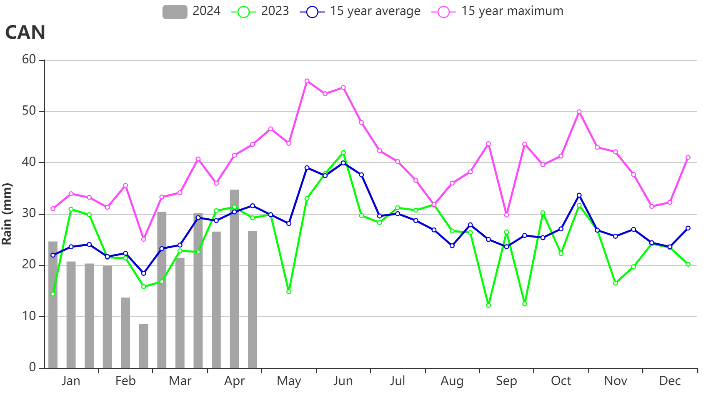
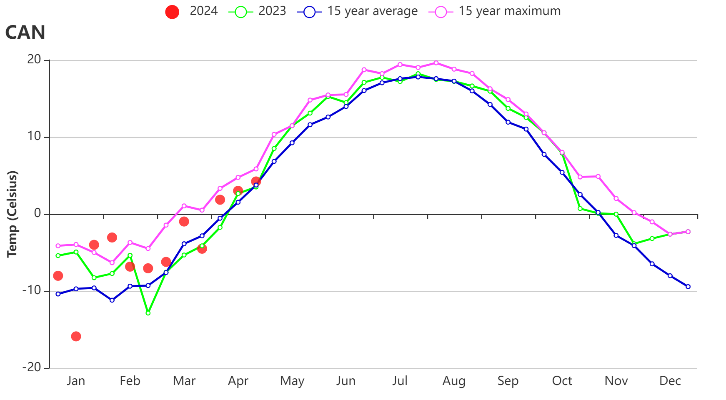
(f) Rainfall profiles (g) Temperature profiles
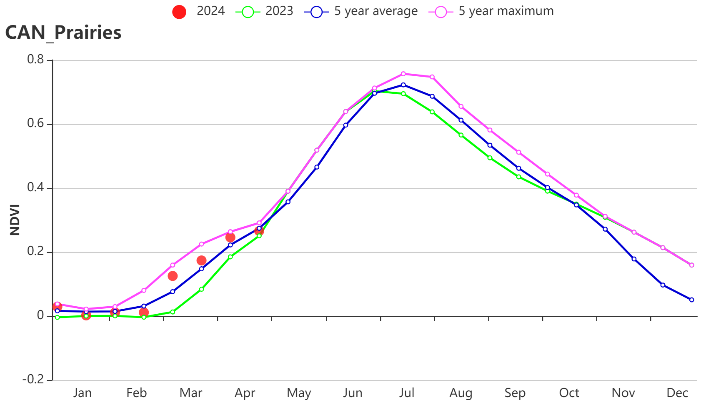
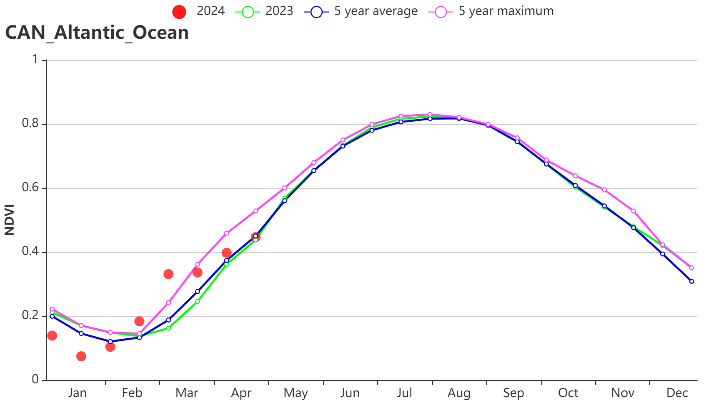
(h) Crop condition development graph based on NDVI (Canadian Prairies region (left) and Saint Lawrence basin region (right))

(i) CPI time series graph
Table 3.15 Canada's agroclimatic indicators by sub-national regions, current season's values and departure from 15YA, January-April 2024
| Region | RAIN | TEMP | RADPAR | BIOMSS | ||||
| Current(mm) | Departure from 15YA(%) | Current(°C) | Departure from 15YA(°C) | Current(MJ/m2) | Departure from 15YA(%) | Current(gDM/m2) | Departure from 15YA(%) | |
| Saint Lawrence basin | 397 | -6 | -1.9 | 2.5 | 497 | -13 | 308 | 17 |
| Prairies | 166 | -9 | -4.5 | 1.2 | 494 | -13 | 277 | 10 |
Table 3.16 Canada agronomic indicators by sub-national regions, current season's values and departure, January-April 2024
| Region | CALF | Maximum VCI | CPI | |
| Current(%) | Departure from 5YA(%) | Current | Current | |
| Saint Lawrence basin | 58 | -1 | 0.82 | 0.73 |
| Prairies | 3 | -27 | 0.86 | 0.97 |
